Retention
Learn how to create retention charts on Houseware
Retention measures how many users return to your product over time. Without retention, a product is a leaky bucket; you can pour in as many dollars as you like into marketing, advertising, and other means of user acquisition and still wind up with no long-term users—which means no sustainable growth and no means to generate revenue.
Retention on Houseware
Use retention heatmap and curve to discover:
- On Average, what percentage of users are coming back to the product on week 2 or week 3 after signing up (first event)?
- Over time, across new cohorts, has my retention (number of users coming back to the product after day or week 0) improved, degraded, or stayed the same?
- Has my retention curve flattened? Do I now have a certain set of users who return to the product at a regular frequency? If yes, then how many (can be identified by checking the flattened percentage value on the Y-axis)?
- For which segment or cohorts of users has the retention curve flattened at a higher percentage? The higher line implies better product retention for that segment or cohort.
How to best utilize retention
The first step to improving your retention rate is to define how it should be calculated. Observing change in active users over a period of time is not the right way to measure it - because an activity by a user on the product does not guarantee value for the user. So before creating a retention chart for yourself, make sure to define these two components very well:
- Critical event: The critical event is an action that signals genuine engagement with your product and also aligns with your business goals.
- For example, For a gaming app - a critical event might be "game completion" rather than simply "logging into the account."
- Product-usage interval: The product-usage interval assesses how often the product is used - daily, weekly, or monthly.
- You should track daily retention if your product is a daily usage product, like WhatsApp. If it is a weekly usage product, like a food delivery app, then use weekly retention to track your product's retention.
Once aligned on these concepts, you can start using Houseware's Retention visualization to calculate and track your product's retention at any time granularity. Let's see how!
Step-by-step guide to creating a Retention chart
Follow the steps given below to create a retention heatmap or a retention curve on Houseware.
Step 1: Add a new Retention visualization block to your workspace
Add a new visualization block on your workspace and choose Retention as the visualization type. Once the block is created, configure it based on how you want to measure user engagement.
Step 2: Select Starting Event
In the config menu on the right side, select the starting event. The starting event determines the total user count for each cohort.
For example, if sign-up is the starting event, then the total number of users for each cohort will be the total number of users who signed up for the product in a given cohort period.
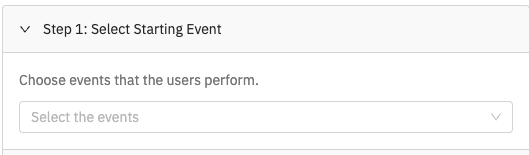
Select starting event
Step 3: Select Return Event
Return event is the event you want your user to return to measure retention. It can be any generic event to measure overall product retention rather than specific feature retention.
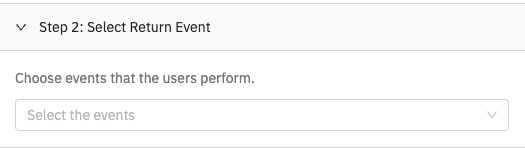
Select return event
Note:
- Both starting and return event can be the same, especially if you are trying to measure feature level retention.
- If required, you can add filters to the start and return events by clicking the add-filter icon on each event's left. Multiple 'AND' filters can be added to each event.
These are the only necessary steps to create your retention chart. Once completed, you can click on the Apply Configuration at the bottom of the config modal, and your retention chart will be up. 🎉
Advanced Config Features
Here are some more features like filters, breakdowns, change retention views, etc., that will help you tweak your retention chart as per your requirements.
Choose Retention View
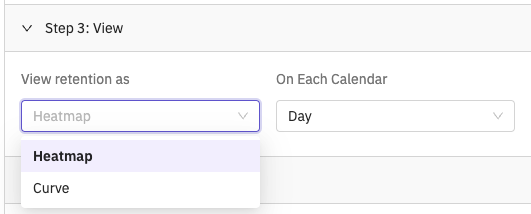
Select retention view
You can view the retention chart in two primary ways:
Retention Heatmap
It gives a granular view of the data broken down by each user acquisition cohort and into relative product usage intervals (relative to the acquisition cohort period). This is the default view if nothing is selected.
Retention Curve
It shows the weighted average of all the cohorts for each relative product usage interval over time. It is a curve with retention % on the Y-axis and time on the X-axis.
Feature Highlight: The retention curve view is handy to check whether the retention curve is flattening. If it is, then it quickly helps in identify at what retention percentage?
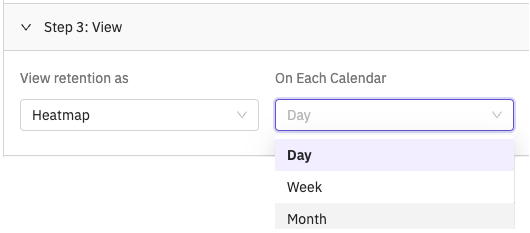
Select the time granularity to see daily, weekly, or monthly retention
Both the view can be configured to be viewed at any time granularity - day, week, or month. On Each Calendar drop-down menu helps you select the same.
Add Filters
In addition to the event-specific filters shared in the note above, you can apply filters for the entire Retention block, common across the starting and return events. Filter them based on user or event properties like country, device type, slot, experiment, etc.
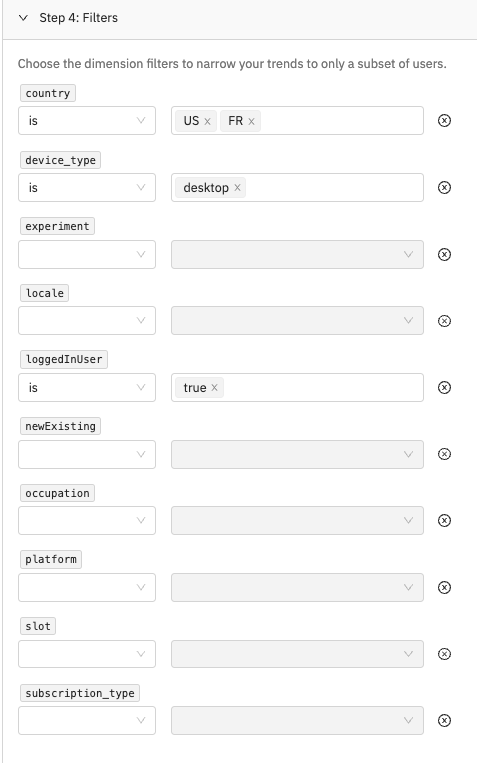
Apply filters on the Retention chart
Feature Highlight: You can use in-built Houseware properties to filter your users.
newExisting: A user is said to be New if they have registered within the last 30 days. Any user who registered before that date range is said to be Existing.loggedInUser:
- To filter for events triggered by logged-in users, set the filter
loggedInUserequalstrue.- To filter for events triggered by non-logged-in users, set the filter
loggedInUserequalsfalse.
Filter by time
You can choose the time frame you want the retention to be computed.
There are multiple ways to select the time:
Between Dates
Choose a start date and an end date (both inclusive). Retention will be calculated over events data in this date range
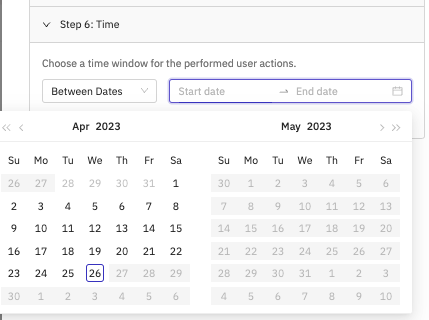
Between dates filter
Within the Last n Days
Calculate retention for the last 3/7/14/28 days. Last n days is a rolling date window to keep your retention up to date
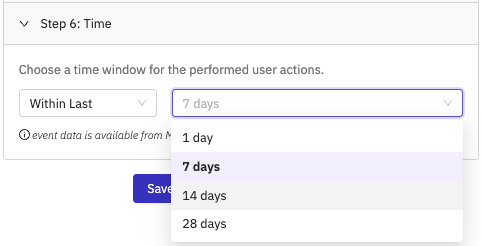
Within Last n Days filter option
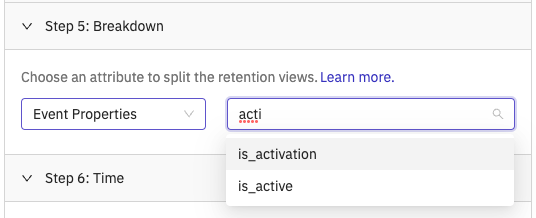
Add Breakdown
Breakdown segments data into groups. Breakdown enables you to go deeper and understand and compare the drivers for event metrics across common event-wide dimensions such as country, device_type, etc., or specific event properties.
We return the top 8 dimension values based on the average retention over all days and cohorts. You can apply relevant filters on the same dimension to restrict the breakdown to a legible count of dimension values on your visualization.
The retention visualization can be broken down by the event properties of the starting event as configured in Step #2.
Add breakdown to group data on your viz
This breakdown can be applied to heatmap as a drop-down filter. The curve view splits into multiple curves based on breakdown segment values.
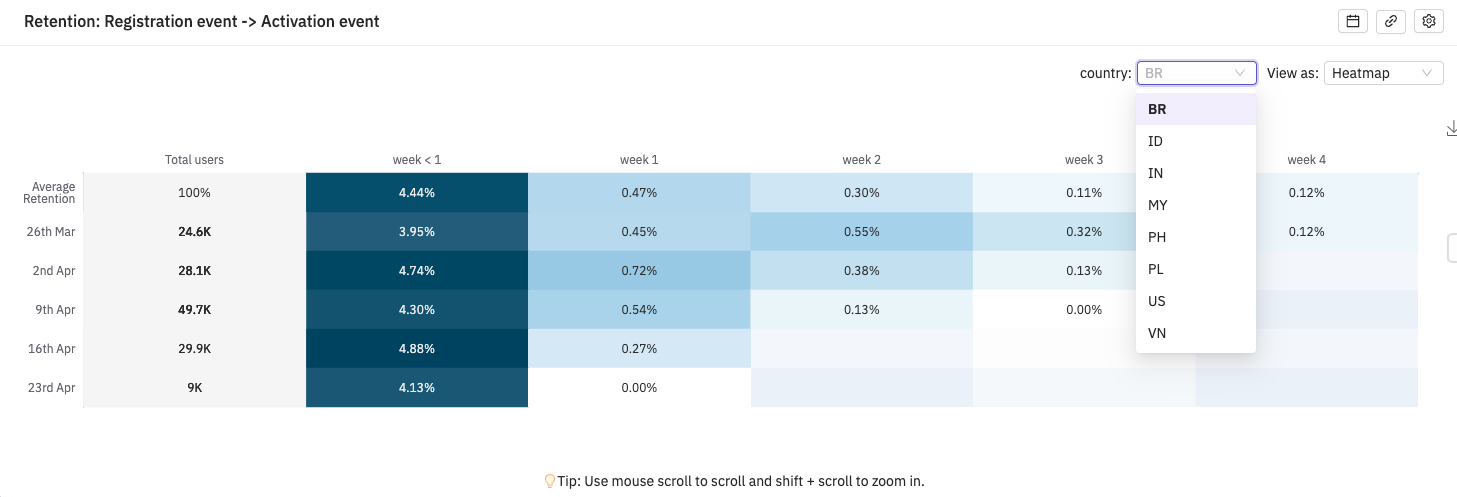
Breakdown on a heatmap view
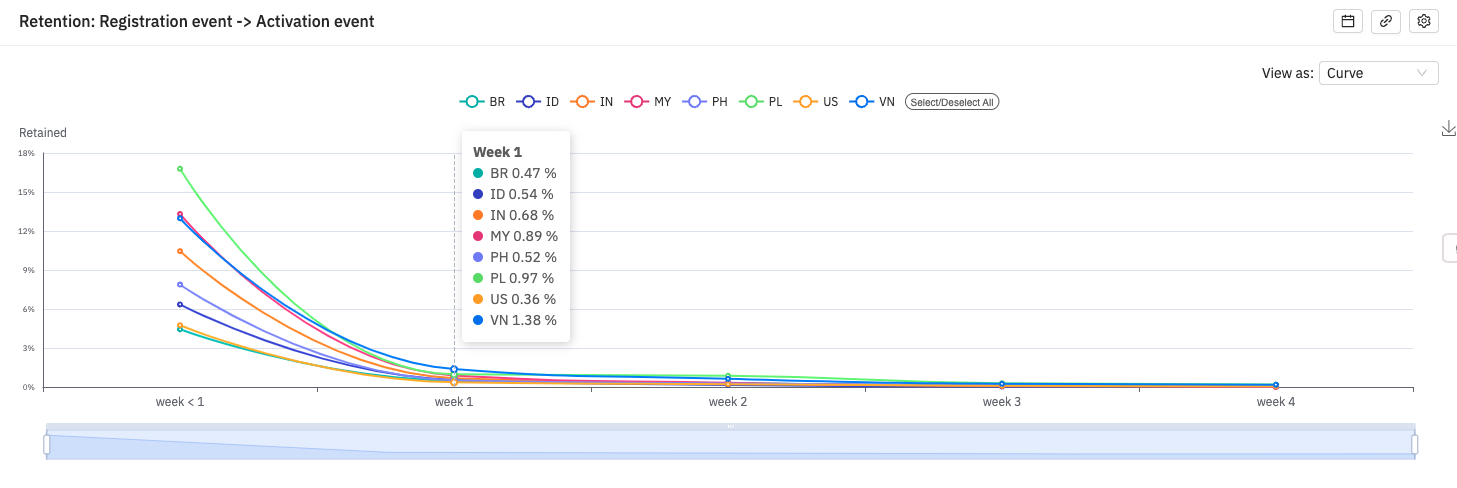
Breakdown on a curve view
🤔 FAQs
How does Houseware calculate retention?
Houseware uses the N-day retention method to calculate retention. N-Day Retention is the proportion of users who come back on the ‘Nth’ day after first use. N-week and N-month also get calculated in the same way.
When measuring N-Day Retention, Day 0 typically refers to the day on which a new user first uses the product; first use can encompass anything from downloading and opening a mobile app to completing a specific action within it. Following that, retention on Day N is the proportion of users who started on Day 0 and returned and were active N days later.
For example, in the screenshot shown below, W1 retention for the 4th September cohort is 84.43% which is calculated by dividing users who came back on W1: 461, with total users who signed up on week 0: 546.
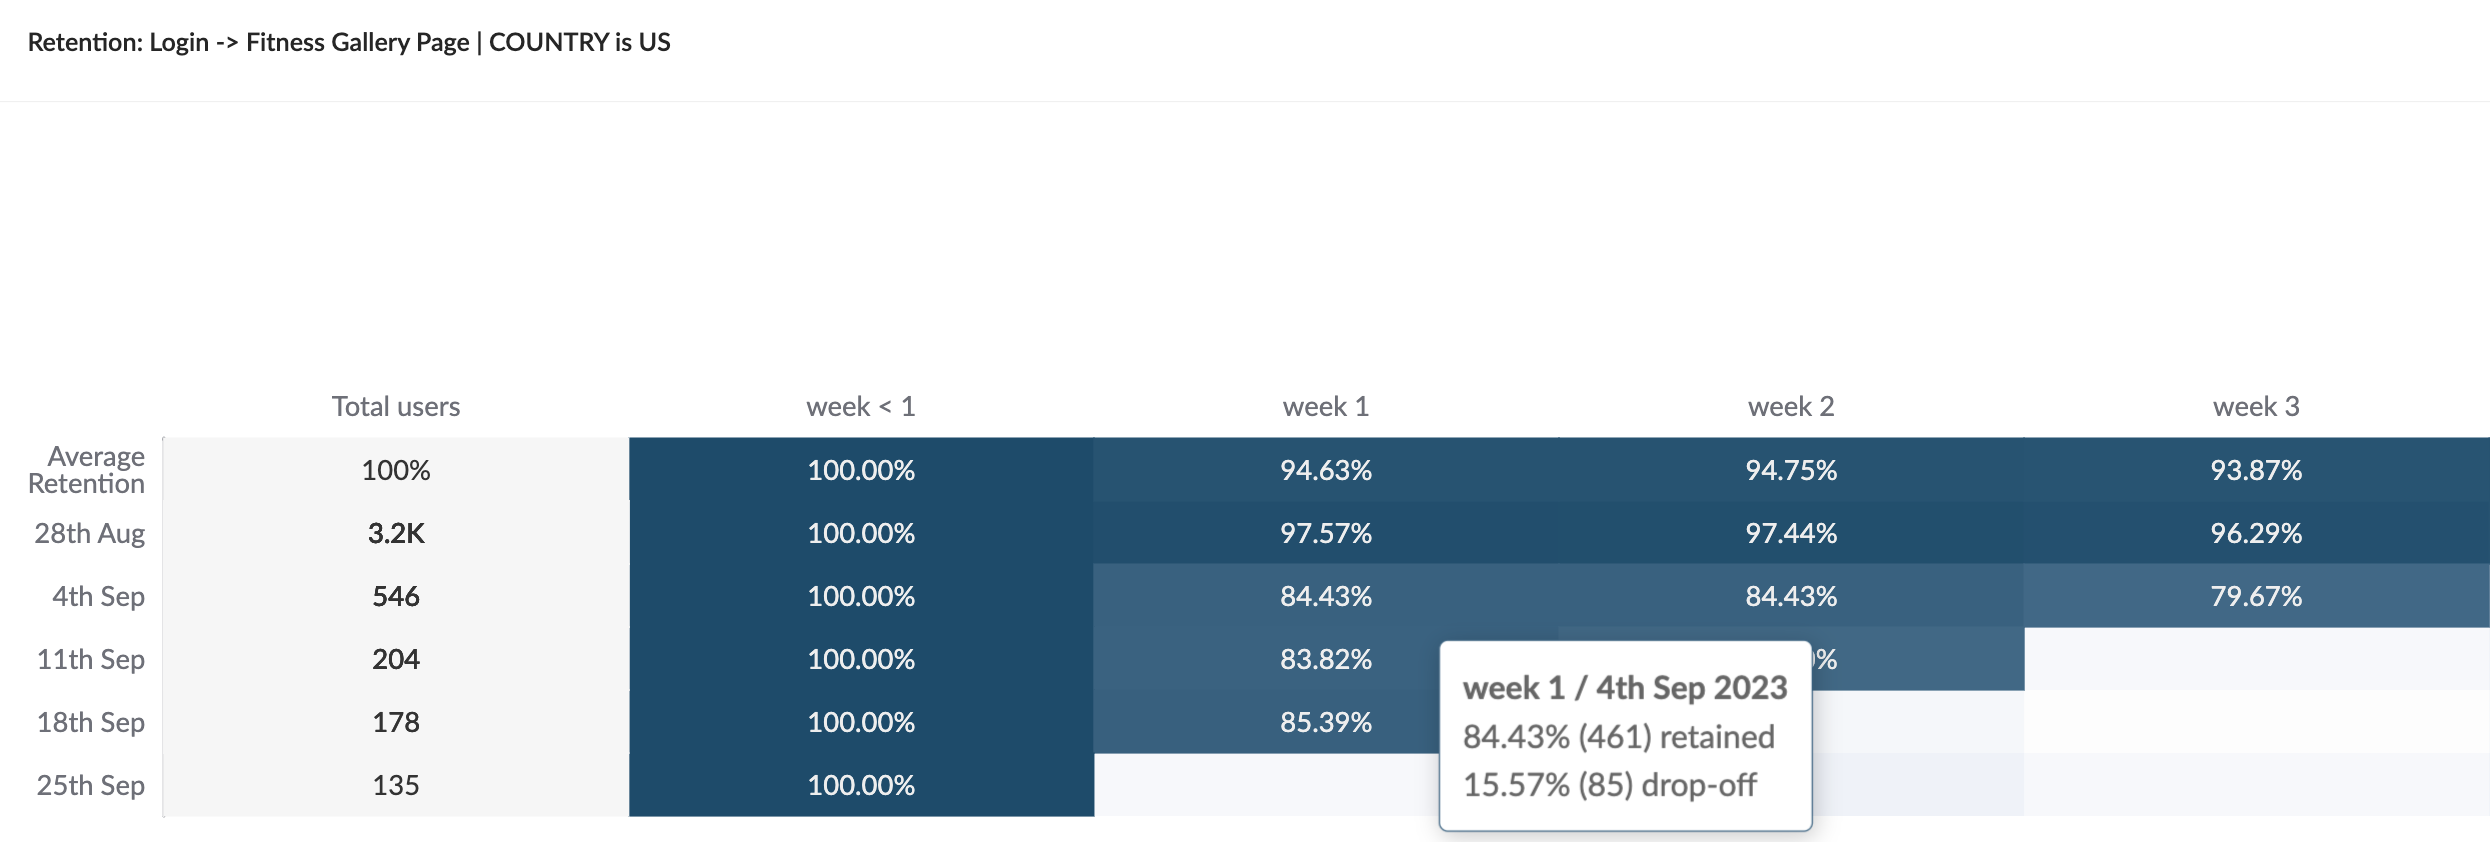
Retention Heatmap on Houseware
How does Houseware determine 'Day 1' and 'Week 1' retention? Is it based on specific calendar dates or rolling time intervals?
Houseware currently calculates user retention based on calendar dates, as opposed to rolling time intervals. Let's clarify these methods:
Calendar retention [Supported by Houseware]
Calendar interval retention is based on 'calendar' time and is calculated using the user's calendar origination time inside the product.
Example: If a user first uses the product at 8 PM on a Tuesday and returns at 6 AM on the following Wednesday, this would count as 'Day 1' retention. The same logic applies to weekly and monthly retention based on calendar weeks and months, respectively.
Rolling interval retention[Not supported by Houseware currently]
In this approach, 'Day 1' begins 24 hours after the user's origination time inside the product. +7 days and +30 days are to be counted for week 1 and month 1 retention, respectively.
Example: If a user did an activity at 8 PM on Tuesday and then again at 6 AM on Wednesday, but did not show up again after 8 PM on Wednesday, the user will NOT be counted in Day 1 retention. It will only be counted in < Day 1 retention.
Note:It's important to understand these methods because they are used differently depending on your team goals. For example, marketing and revenue teams that align their activities with specific calendar dates generally prefer using calendar-based retention.
Can a user define custom time intervals to measure retention, apart from D1, W1, and so on?
Absolutely yes! In Houseware, you can define custom time intervals to measure retention instead of following the pre-defined time intervals. Based on different use cases, there might be a need to define a custom bucket like 14 days, 14-28 days, etc. Houseware allows users to configure these custom buckets daily, weekly, and monthly.
For example, if your product offers free trials for a time duration like 14 days, or 75 days you will like to measure retention at 14 days or 75-day intervals. This will help in understanding the number of users who came to use the product during the trial period and post the trial period once it was over.
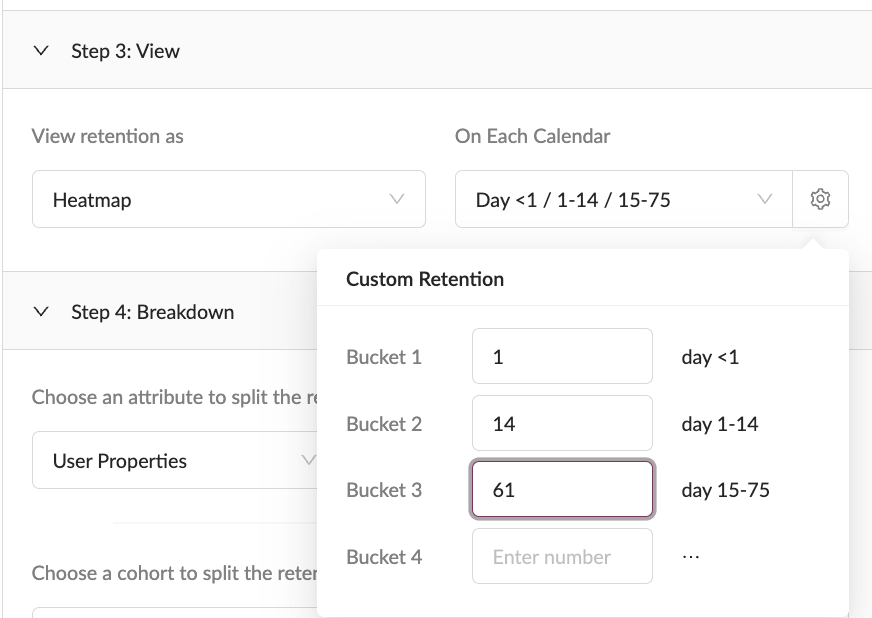
Custom time buckets for retention heatmap
Updated 9 months ago