Cohorts
Learn how to create cohorts on Houseware and use it for your analysis
In Houseware, Cohorts are a group of users that share common characteristics. They are super useful to analyze your data only for a particular set of users. It is an ideal combination of user properties and actual event-based behavior on the product. To know more about it, refer to building blocks of Houseware.
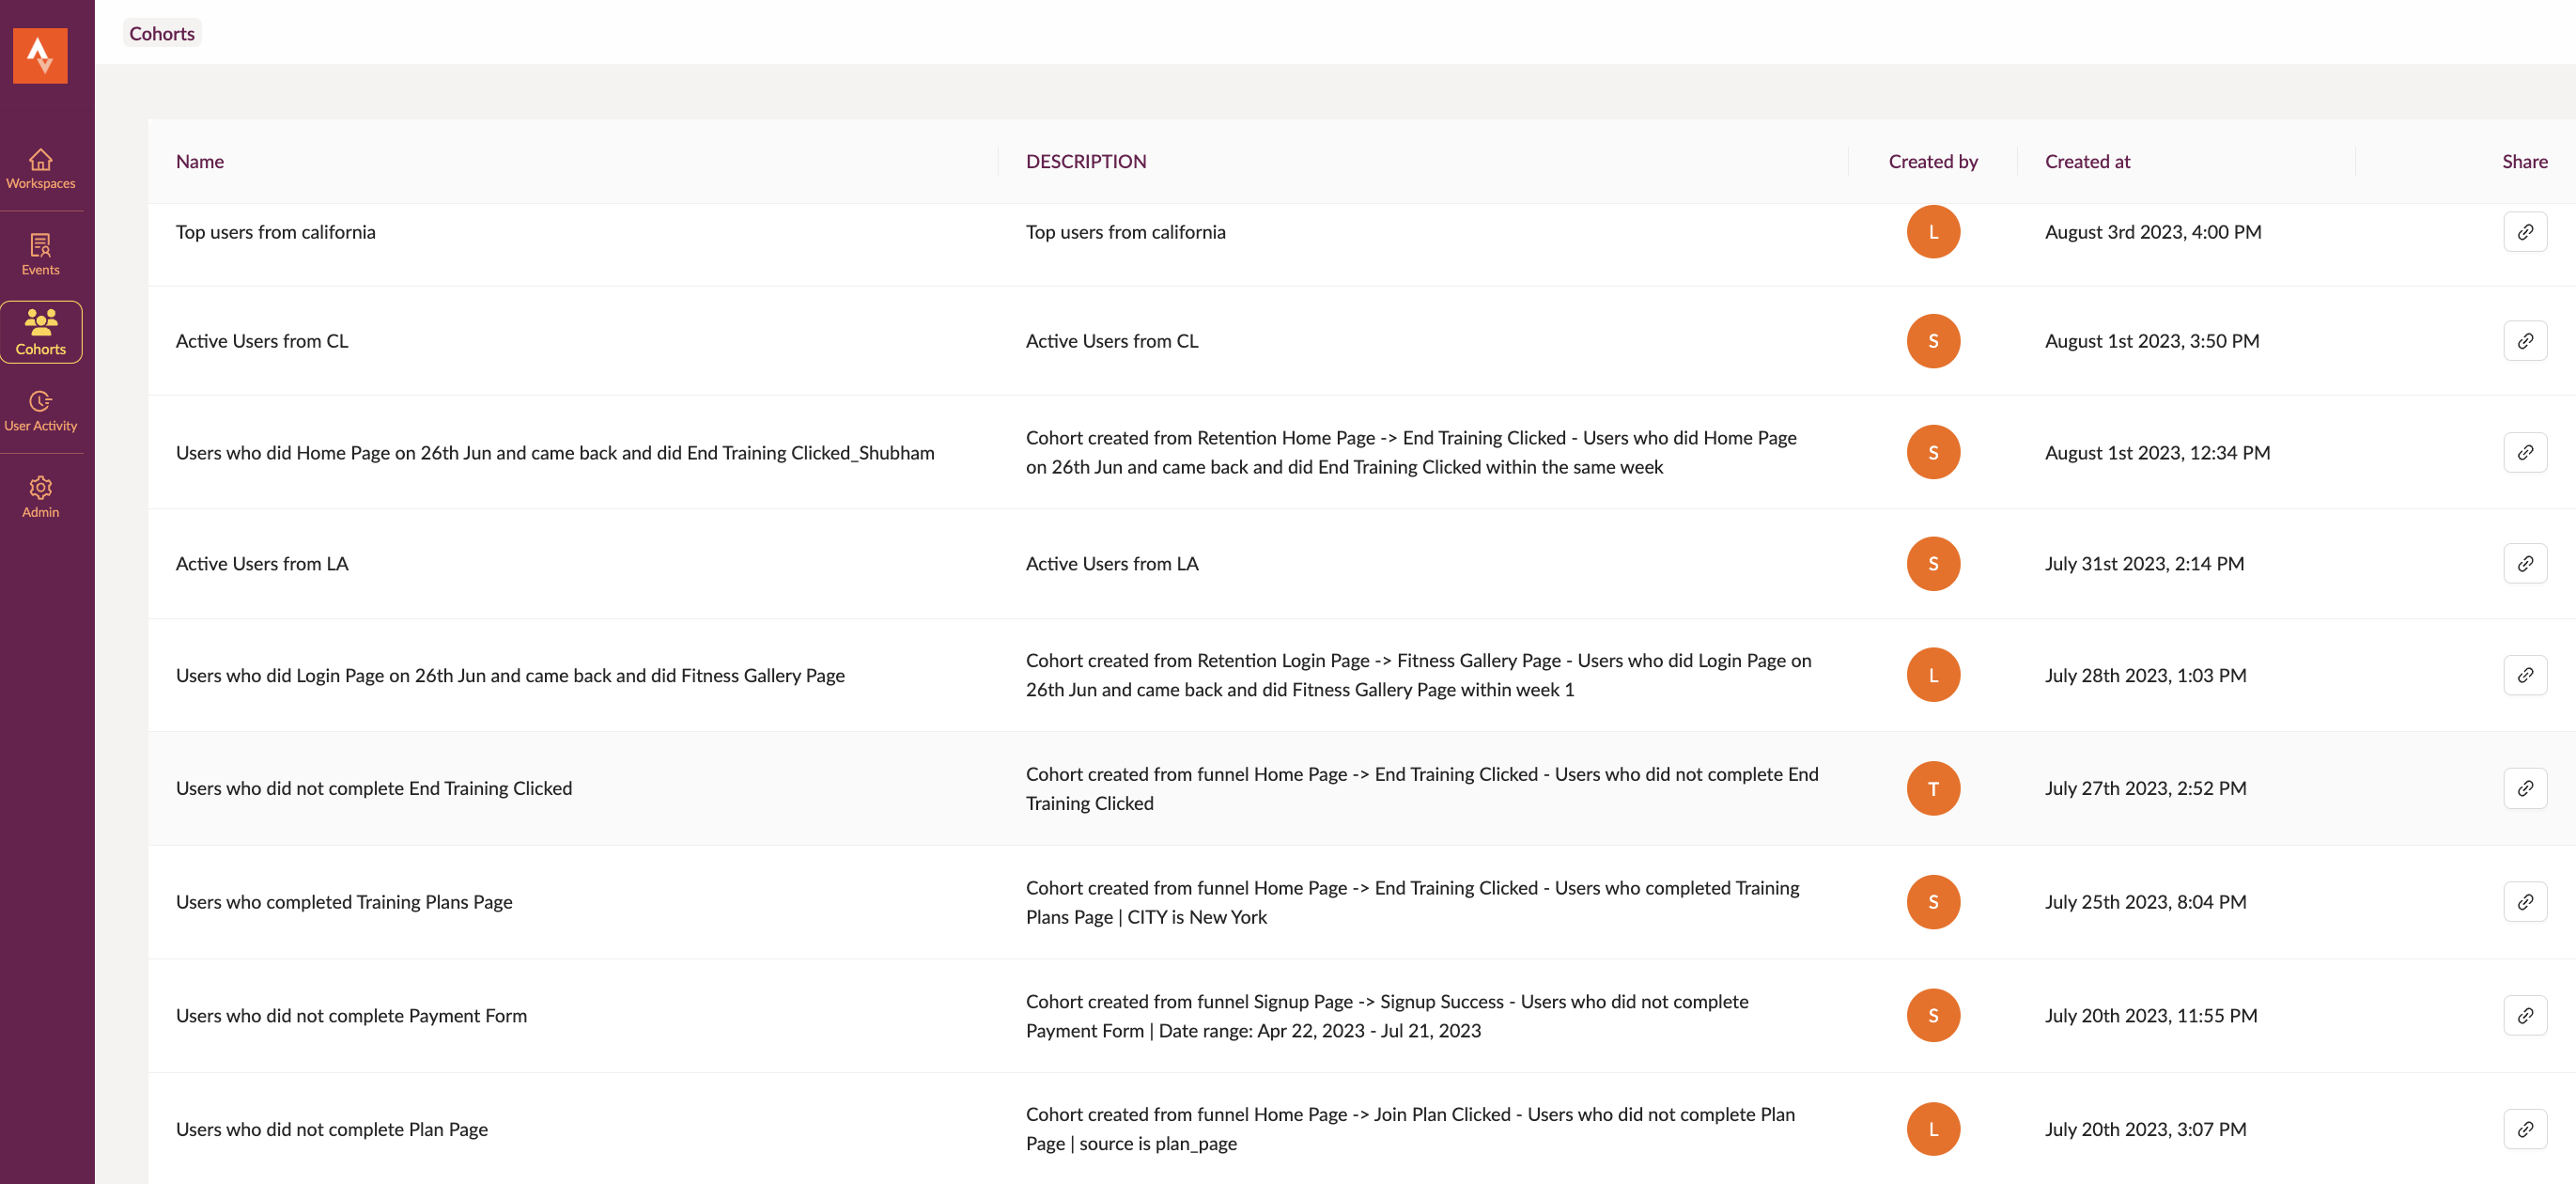
Cohorts page on Houseware
Cohorts can be super helpful if you want to restrict your analysis only to a specific set of users. And that specific set emerges from a combination of user properties and events behavior. The users create cohorts by applying appropriate filters (AND, OR, both can be used) on top of user properties and event behavior, or a combination of both.
- User properties. For example, city, region, plan type, device type, etc.
- Event behavior. For example, users who click on in-app notifications.
Without any further delay, let's deep-dive into how to 🥣 create cohorts and use them on Houseware.
Step-by-step guide
Follow the steps listed below to create a cohort on Houseware
Step 1: Click on the Cohorts tab
Once you log in to your Houseware instance, click on the Cohorts tab on the left-hand navigation panel. It will take you to Houseware's Cohorts page.
On this page, you will be able to see the name of your cohort, a short description (as added by the creator), the user who created it, the date of creation, and a link to share it with your colleagues.
Step 2: Click on the +New Cohort button
- Click on the +New Cohort button adjacent to the search bar at the top of the page.
- You will be directed to the Create Cohort page as soon as you click.
Step 3: Add name and description
- Give your cohort an appropriate name and description. Even though the description is not a mandatory field, adding it will help you understand what your Cohort is about.
- Add filters that will help you create your cohort.
Step 4: Choose appropriate filters
A filter group is a set of filters that you define that are all connected by "And" - meaning a user qualifies as part of it if they satisfy all the filters within it.
A cohort can have multiple filter groups which will be connected by "Or", meaning a user will be part of the Cohort if they satisfy the criteria for any of the filter groups.
There are two types of filters:
- User Properties: These filters start with
Where. - Events: These filters start with
Who.
User Properties:
- Select user properties from the filter drop-down menu.
- It will show user properties and their values to select from the drop-down menu, as shown in the gif below.
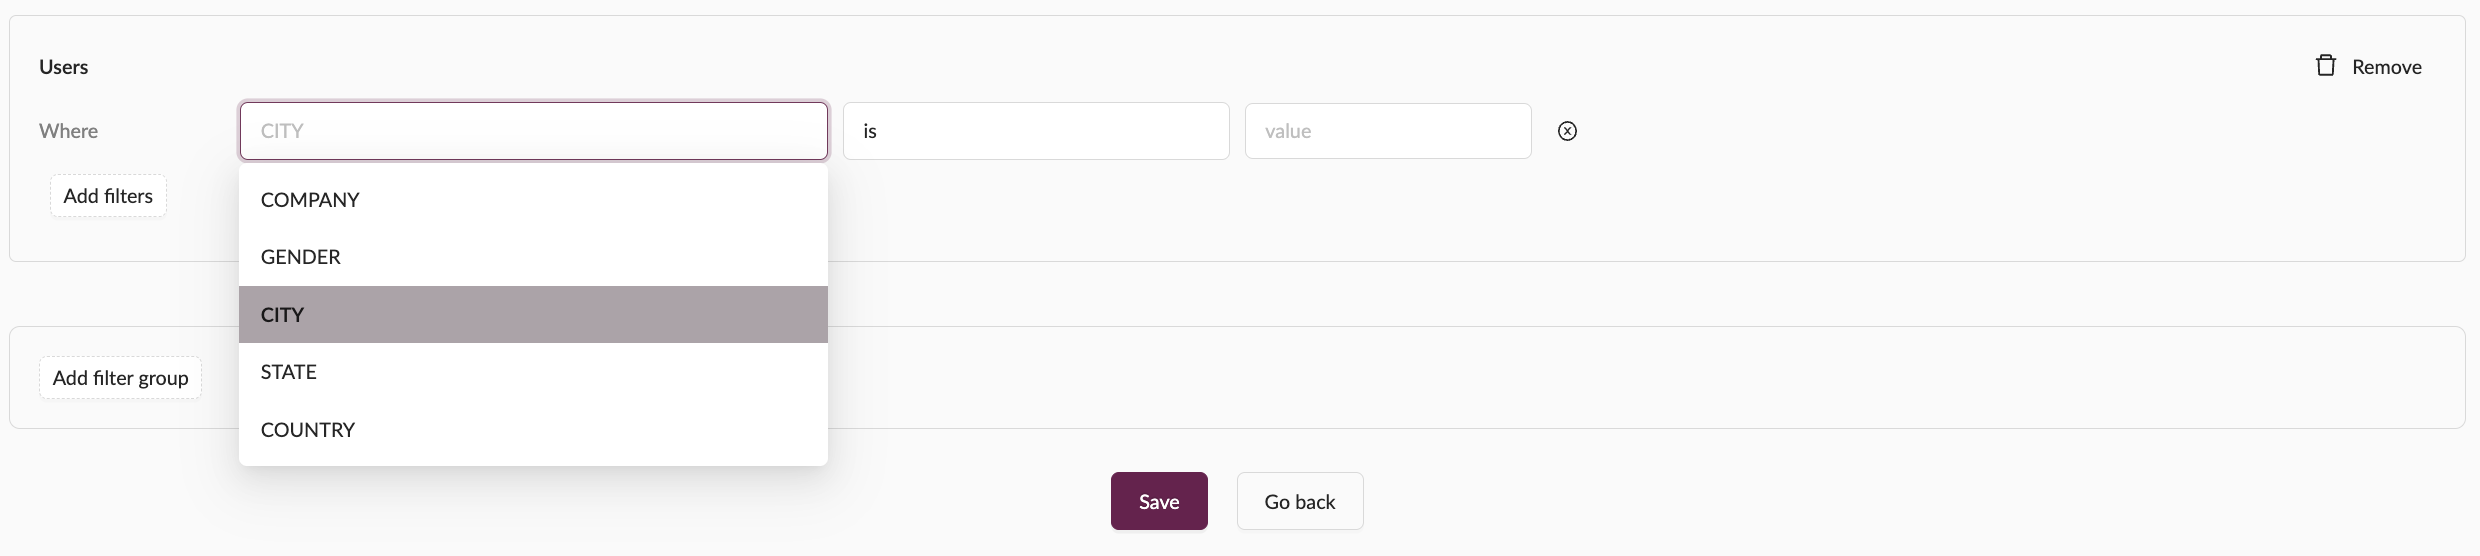
Select User Properties
Events Behavior:
The entire event filter is divided into 6 parts.
- did or did not: To choose if you want to filter by users who did or did not do the selected event
- Event name: The event already selected in the drop-down shows up in this part.
- Aggregate function: By default, it is selected as count, as it will count the number of users.
- Counting criteria: Choose the condition according to which you want the users to be counted. Like -
is,is not,greater than, `greater than equals,less than, etc. - Additional counting criteria: If you want to add more than 1 counting criterion, add it in the 5th part.
- Time: Select the time period for the event to have been triggered. For example, 1 day, 7 days, 28 days, etc.
Event filters
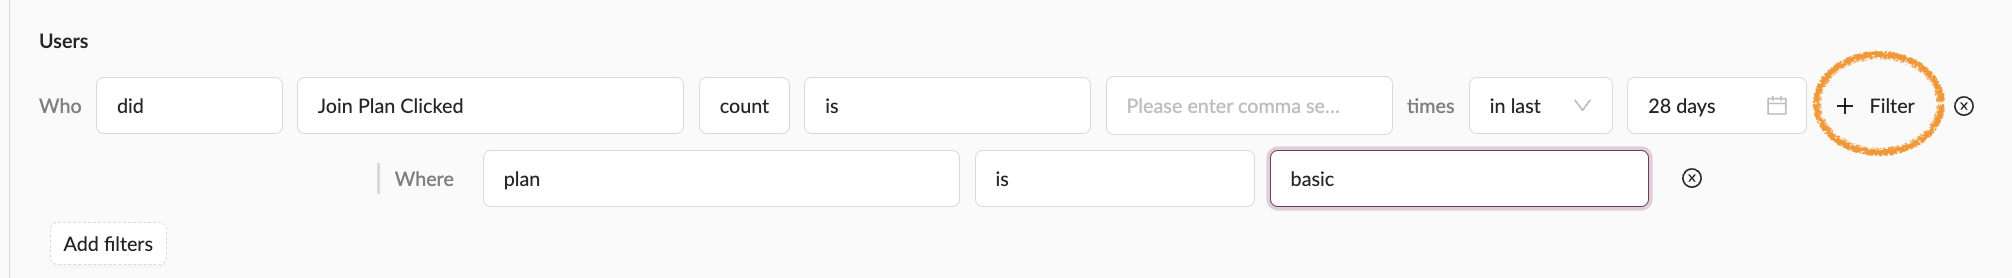
Nested filters: In the same filter, more details about the event or user property can be added by clicking on the
+ Filteroption given on the right-side of your filter statement. For example, users who clicked Joint Plan should belong to the planbasic. This information can be added using the+ Filteroption.
Feature Highlight: Multiple AND or OR filters can be added by clicking on the
Add Filtersbutton below, which allows creation of complex cohorts, as shown in the gif below.
Add an AND filter to create a cohort
To make sure that you do not make mistakes while combining the AND and OR filters, the AND filters are given precedence and hence stuck together, in the same box, whereas OR is separated.
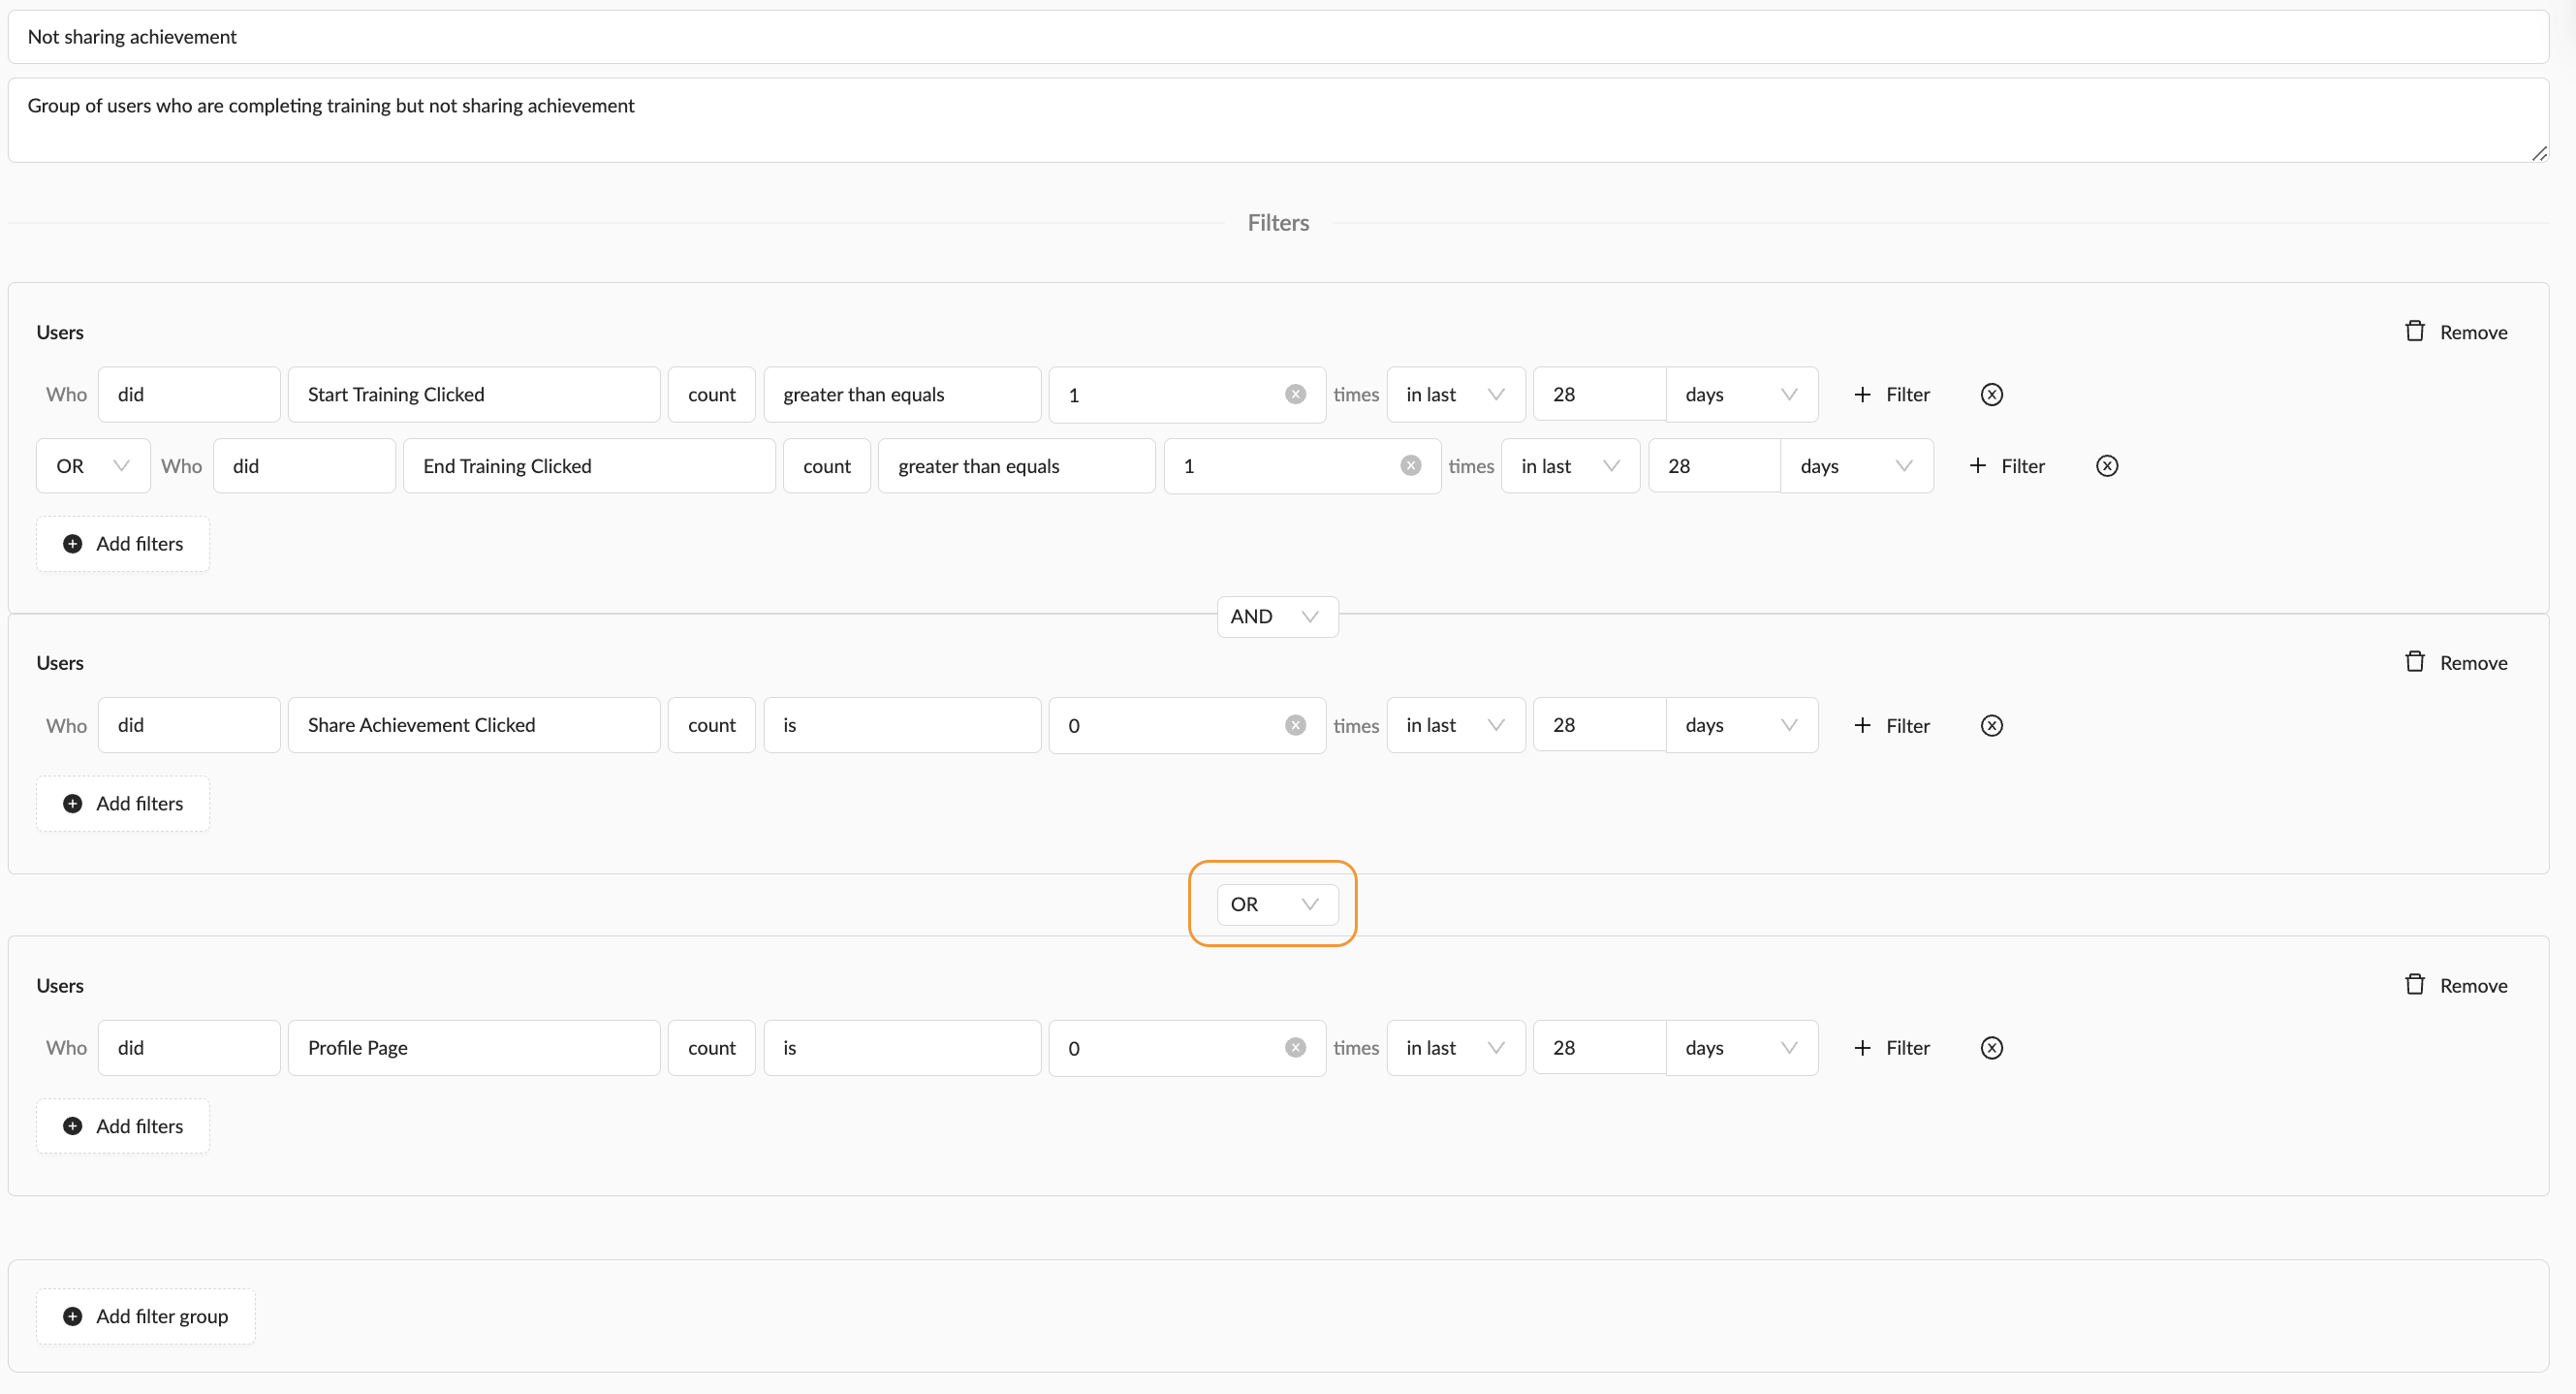
The OR filter group is separated, whereas the AND filter group is stuck together
Just like in arithmetic operators, if the brackets are missing, then an expression as given below might lead to different results:
- 1 + 2 * 3 = 7
- 1 * 2 + 3 = 5
Similarly, to make sure that the user gets the intended number of users in their cohorts, a visual hierarchy that separates the AND and OR filters ensure accuracy in the cohort creation process.
Also, within the same filter group, to ensure accuracy, you can only apply either AND or OR filters if there are more than two filters in the same filter group.
For example, if you want to create a cohort of users who did start a training or end a training but did not share their achievement, this is how you will create it:
How to use filters and filter group
Note: As you can see in the GIF above, inside the same filter group, which means at the same hierarchy, we cannot have both
ANDandOR. Hence, to add anORfilter, we use the Add filter group option.
Step 5: Click on the Save button
Click on the Save button and 🎉 your cohort is created, saved, and ready to be used!
You can now use this cohort to use as a breakdown or filter in visualizations like Funnels and Trends, as shown in the gif below.
Use Cohorts as Breakdown
Now try it out for yourself! 😎 and feel free to reach out to us if you have any questions!
Updated 11 months ago