Funnels
How to create funnels on Houseware and use it to identify the drop between different steps
Overview
Houseware's no-code, interactive product analytics capabilities empower the user to create powerful visualizations that help in analyzing the product event data the best.
The funnel type of visualization is the best way to understand how the end-users perform events in a series, and how many users dropped in between different steps. Houseware lets you create these funnels in just a matter of a few clicks.
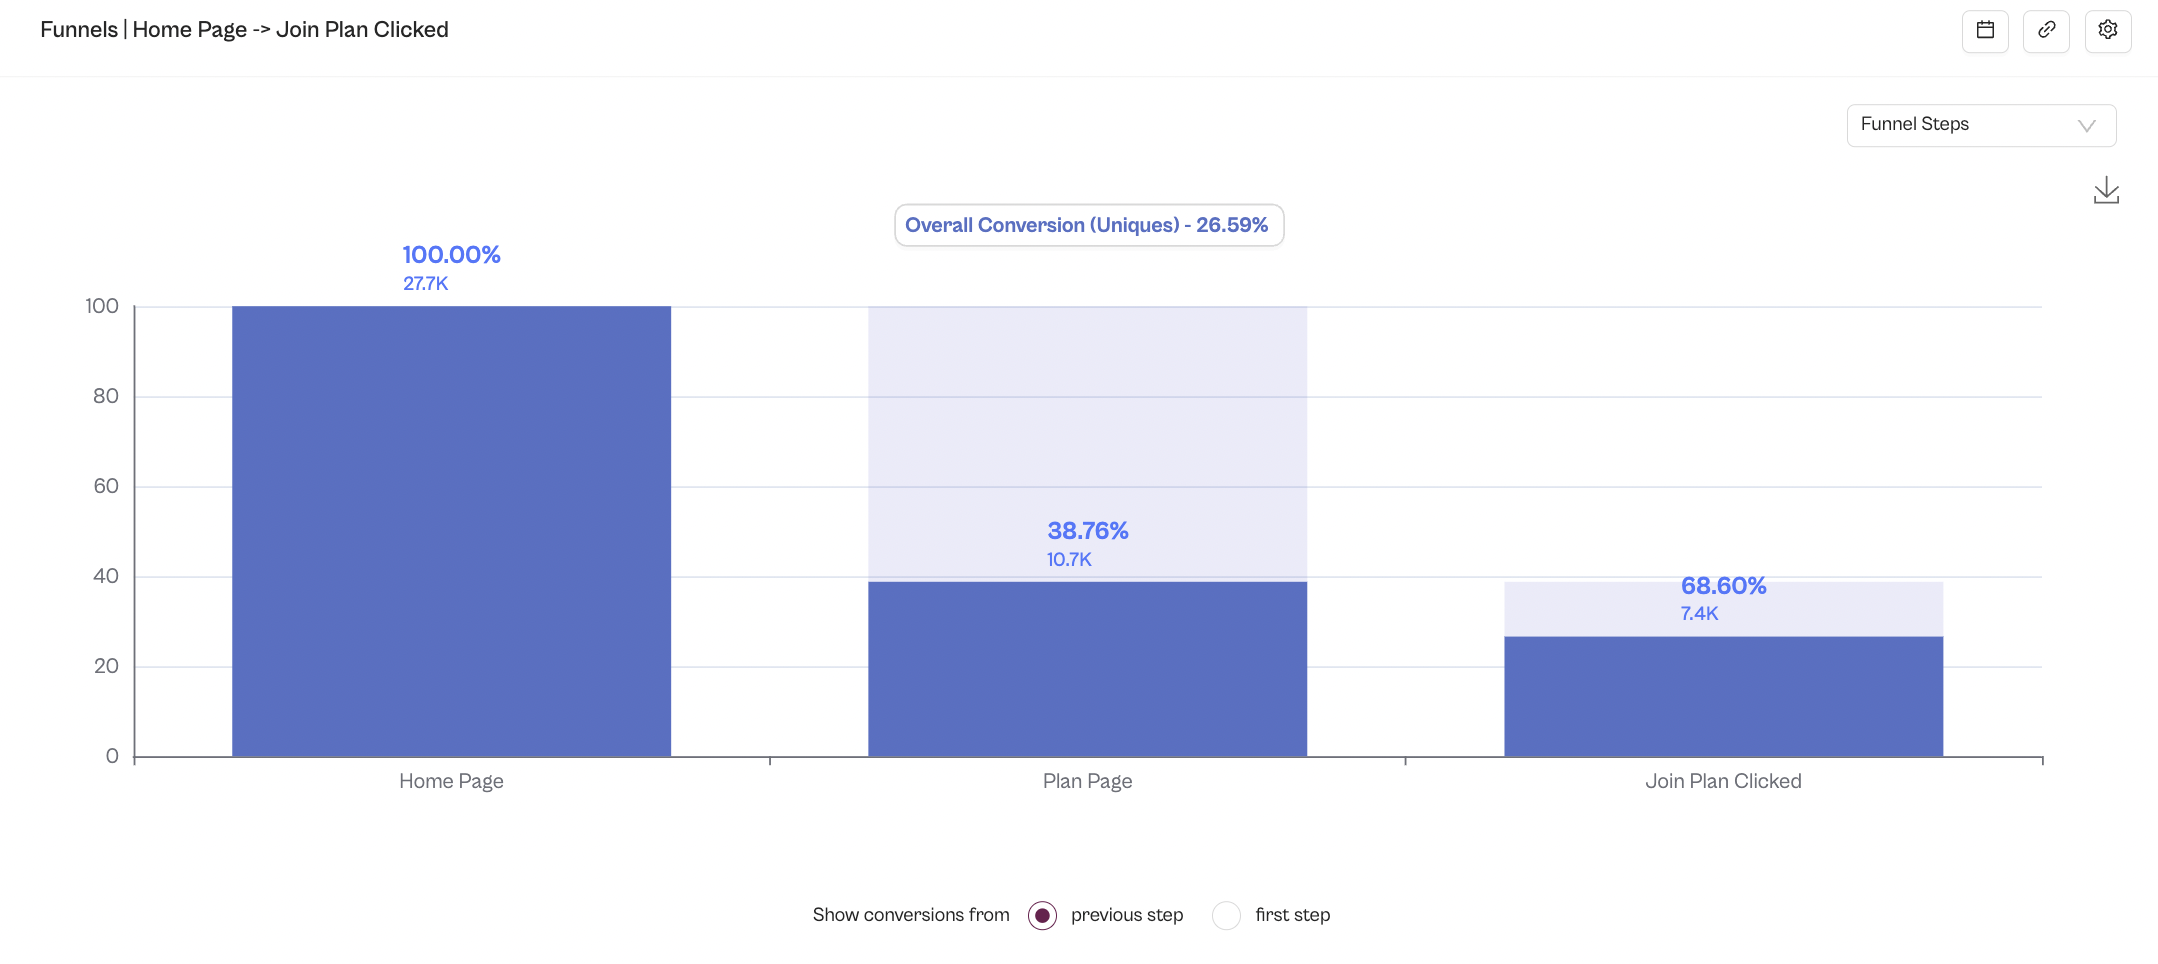
Houseware 3-step funnel
What is a funnel?
Funnels calculate the number (and percentage) of users converting from one event to another within a certain conversion window. This gives you the ability to analyze where your users drop off, what segments convert the most, and other important aspects of the user journey.
Use Funnels to discover:
Here are some example questions that a funnel visualization can help you answer:
- What percent of users converted through my signup Funnel within an hour?
- At what step of the signup Funnel did most users drop off?
- Which countries and devices have a higher/lower signup conversion rate than others?
- How did my A/B test, or the latest feature release impact conversions in the signup Funnel?
- Has my conversion rate for a particular funnel gone up or down over a period of time?
- How much time, on average, is it taking for users to convert between different steps of the funnel?
What counts as a conversion?
Before we create a Funnel, let's understand how it computes conversion. For a funnel analysis, a user must complete the steps you designate in your Funnel in loose order. By loose order, we mean - that a customer can engage in other actions between Funnel steps as long as they complete them in order.
Let's start with an example where the Funnel has steps: A, B, C, D, E and go through a few cases:
- The customer does step A -> B -> C -> D -> E in exact order. Houseware counts this as a conversion.
- The customer does step A -> B -> F -> C -> D -> E. Houseware counts this as a conversion and is also an example of loose ordering.
- The customer does A -> B -> D -> C -> D -> E. Houseware will count this as conversion. Even though the customer did D before the first time they did C, they will continue to convert because they eventually did a D after C within the conversion window.
- The customer does step A -> B -> C -> E. Houseware will not count this as a conversion for E but will measure conversions for B and C, and the customer will not appear in the Funnel after step C. The customer's completion of step E is excluded from the Funnel because step D did not occur.
- Only users who have gone through each former event in the configured Funnel will appear in any step. (i.e., for Funnel A->B->C, users going from A to C directly will not show up in the Funnel)
How to create a Funnel?
Here is the step-wise guide to help you create a Funnel visualization on Houseware.
Step 1: Choose the Funnel type of visualization on your workspace
- On your workspace, select the + icon to add a new Block.
- Hover over visualizations as the block type, and select Funneld as your visualization type.
Step 2: Configure the Funnel settings as per your needs
Once your Funnel block is created, a config selection menu will open on the right-hand side. You can choose the following to generate the Funnel as per your requirement.
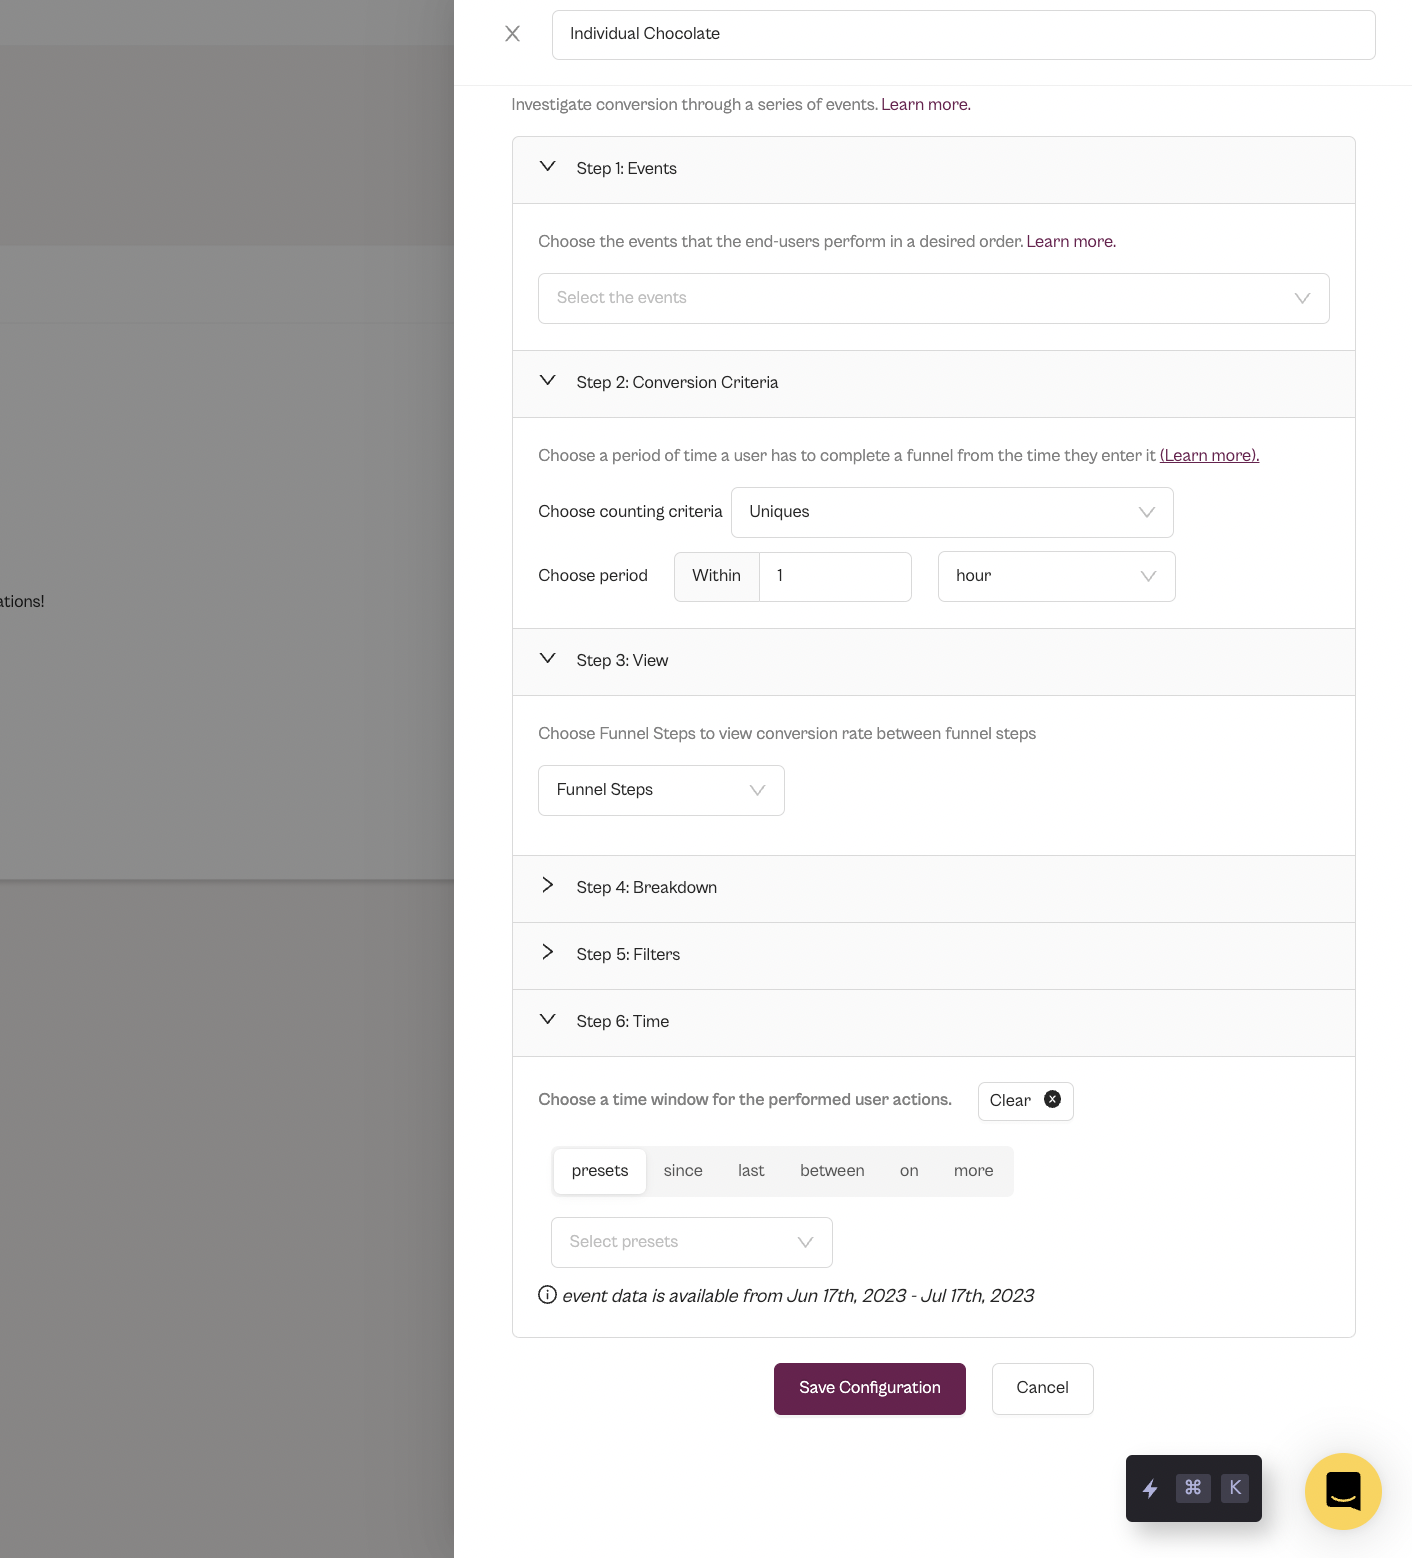
Funnel configuration options
- Events: Select Events that you want to see in the Funnel sequence.
- Conversion Criteria:
- Counting Criteria: Choose if you want to see unique users or the total number of times a user was converted to each step of the funnel.
- Conversion Window: Choose under what time duration a user should be converted to be counted in your funnel.
Note: To know more details about the conversion criteria, check out our FAQ sction.
- View: Select the type of funnel view you want to see. It can of three types:
- Steps view: It shows all the steps in the form of a bar chart and the converted %'s and counts at each step. By default, the funnel will show by this view only.
- Trends view: It shows a conversion line chart over time
- Time to convert view: It shows the avg time bracket a user took to move between different steps.
- Breakdown: It helps in splitting the funnel by a selected user or event property like region, device type, and several more.
- Filter: It helps in filtering the entire funnel by selected user cohorts or event property(s)
- Time: It helps filter the entire funnel for a selected time period.
Once you have selected your config options, click on the Save Configuration button at the bottom, to save your settings. Keep reading ahead if you want to know more about each of these configuration options.
Funnel configuration deep-dive
Events
Select the events of the Funnel in the order you require. You can have up to 5 steps in each Funnel.
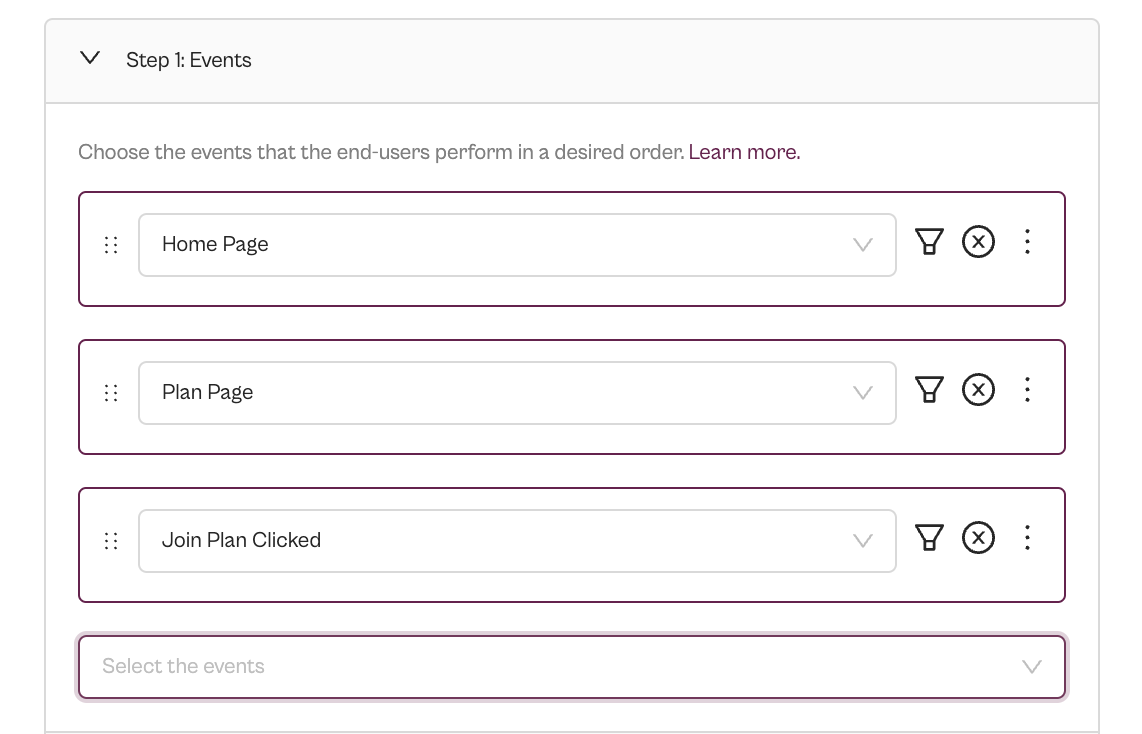
Select Funnel events
Use the "x" icon to remove an event. You can even change the order by clicking on the six dots to the left of the event and dragging it.
Event level filters
You can also apply a filter at an event level! Based on the various event and user properties associated with the event, by clicking on the filter icon next to each event on the right, as shown in the gif below.
Apply event level filter
First Time Filter
Apply first-time filters on specific events to filter your analysis to see the very first instance of users doing the event(s) — across their entire lifetime. Use this filter to study early user behavior. This filter can be found by clicking no on the 3 dots next to "x" icon, as shown below.
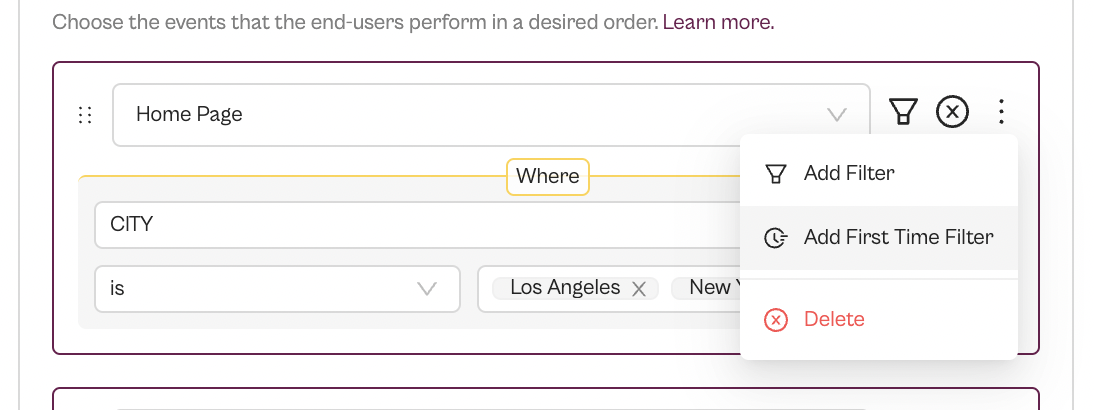
Apply first time filter
Conversion Criteria
Counting criteria determines how many times Houseware counts a particular user's activity towards conversions. Funnels can be calculated by Uniques and Totals. Funnels are calculated by Uniques by default, criteria can be changed by using the apt option from the dropdown.
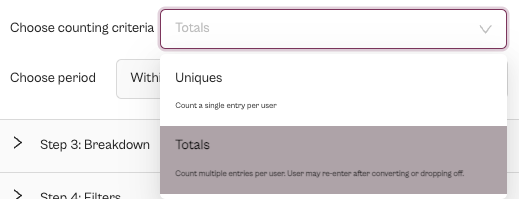
Select Uniques or Totals
Uniques
The Uniques option accounts for the number of users who completed the funnel. Even if the user completes the funnel multiple times within the configured date range, the user is only counted towards conversion once, and this is on the first time they perform the first step of the funnel.
Totals
The Totals option accounts for all the number of times users converted through the Funnel and counts multiple entries per user. Users can re-enter the funnel and are counted for conversion every time they enter it. A re-entry into the funnel begins every time a user performs the first step of the funnel, and each time this happens the previous funnel entry is assumed to be completed.
Conversion Window
The Conversion Window determines how much time a user has to convert through all steps of the funnel after entering it. The conversion window setting is ideal for use cases where you want more control when measuring conversions with a time duration goal.
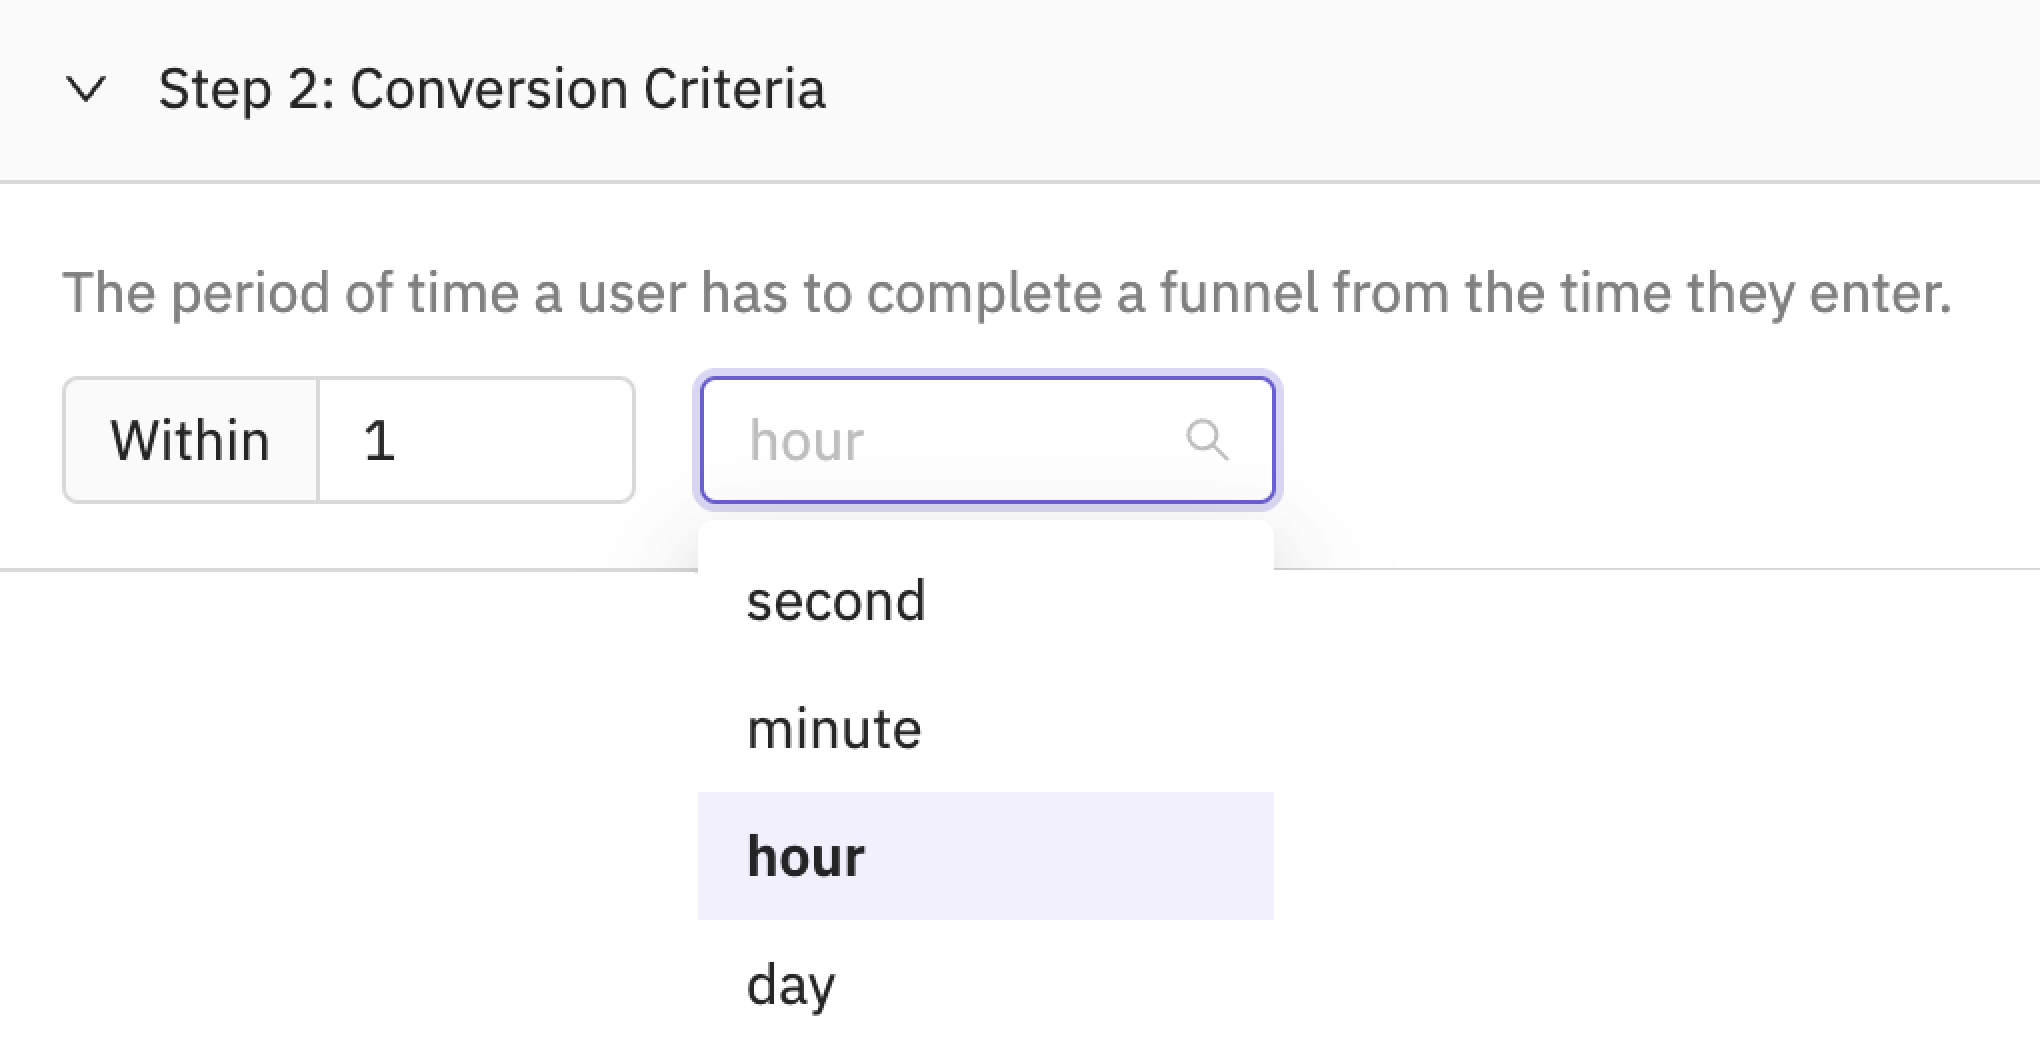
Select a conversion window
Note:
By default, the conversion window is set as 1 hour by default.
Funnel Views
The funnel visualization can be viewed in 3 ways:
- Funnel Steps View
- Time to Convert View
- Funnel Trends View
The Funnel steps view is the default view.
We often need to analyze how much time users take between two events on the product. Select Time to Convert (from the drop-down list on the top-right of the visualization), to analyze how long users take to convert through your funnel.
By default, Houseware displays the time to conversion through the entire funnel (between the first and last step in the funnel). The chart updates if you select a specific step in the funnel above to indicate the conversion rate up to that step, rather than the full funnel.
By default, the interval for this chart is 2 minutes, but you can click on Interval size at the top of the chart to edit this. You can also specify the Min and Max for Time to Convert.
Time to Conver Funnel view
Note: To know more about how time intervals are calculated, read more here in the FAQ section.
Funnel Trends view
To understand the conversion trend over a period of time, the Funnel Trends view can be used. It shows the percentage converted, between all steps of steps selected by the user across time. It can be viewed at an hourly, daily, weekly, monthly, or yearly time granularity.
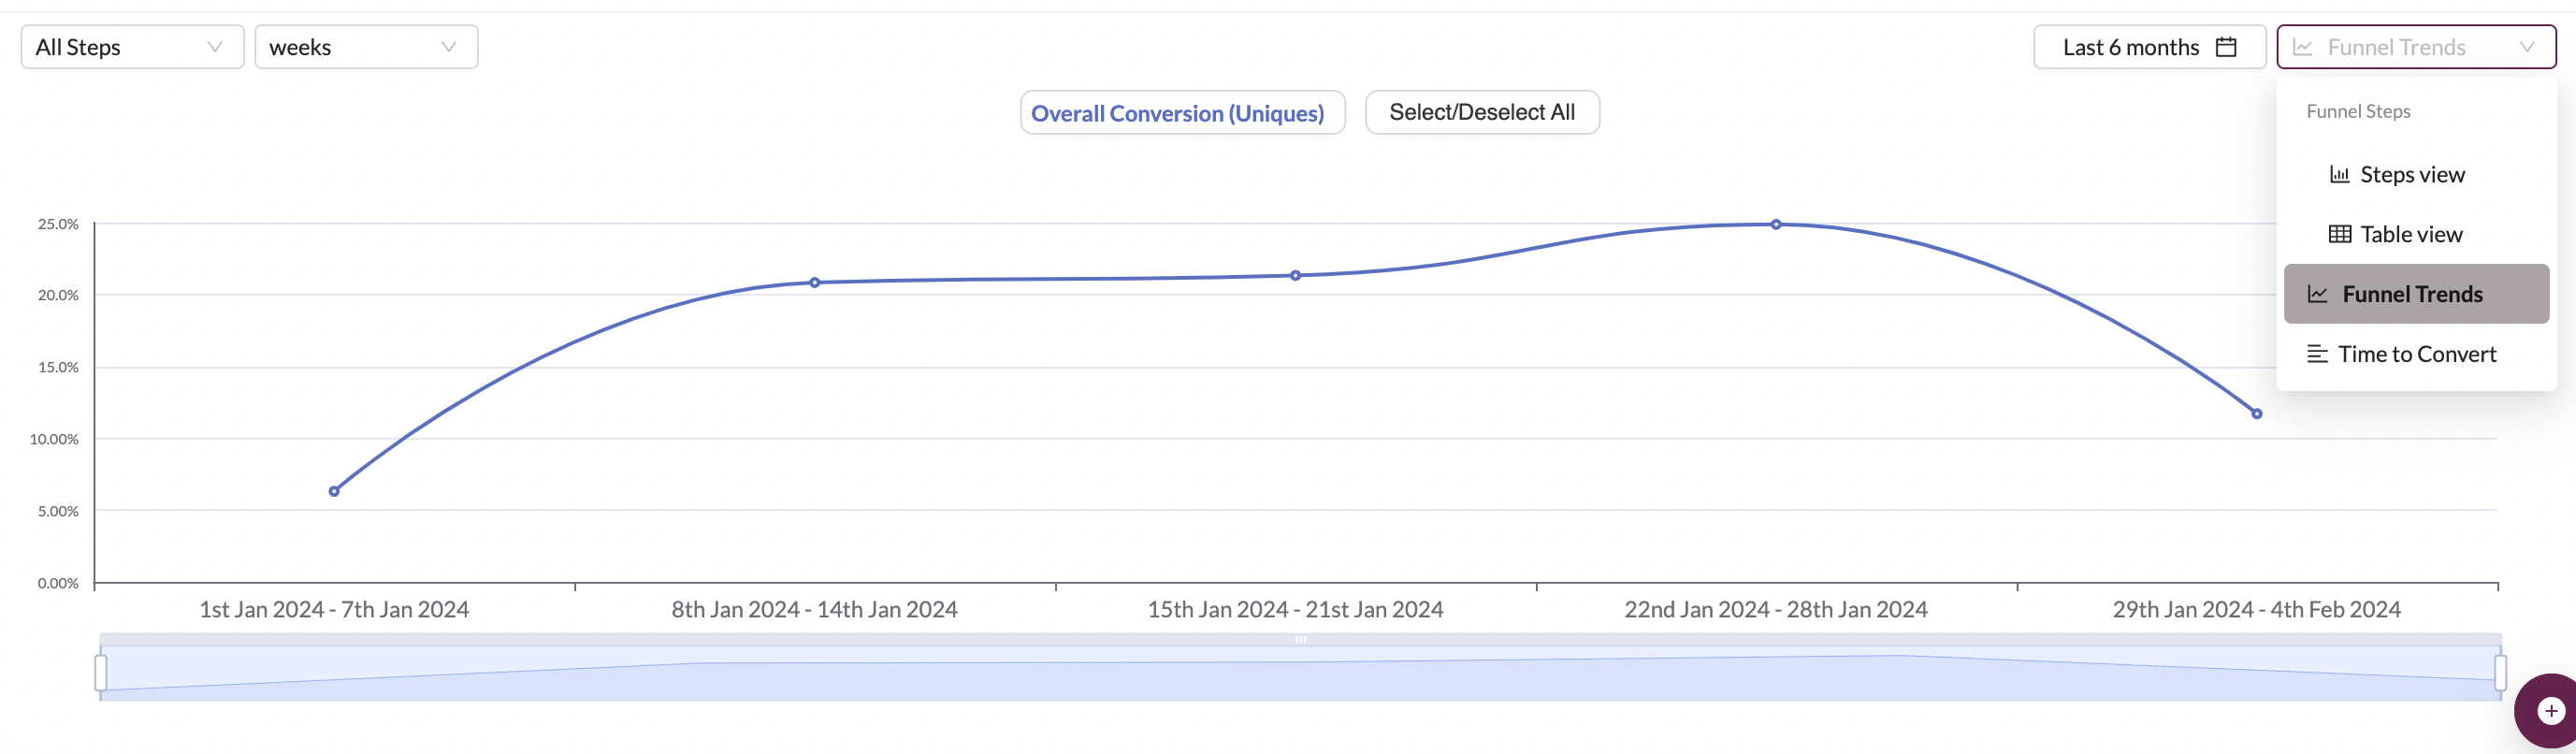
Funnel Trends View
This view is very useful if you want to check if your conversion for the funnel is increasing, decreasing, or not changing over a period of time. Because the Funnel Steps view only shows the funnel conversion snapshot for the time range selected.
A user that completed the funnel within the conversion window is counted on the day, week, month, etc., corresponding to when they performed the first event in the funnel.
Houseware allows for an easy toggle option to switch from a steps view to a trends view, as shown in the screenshot below.
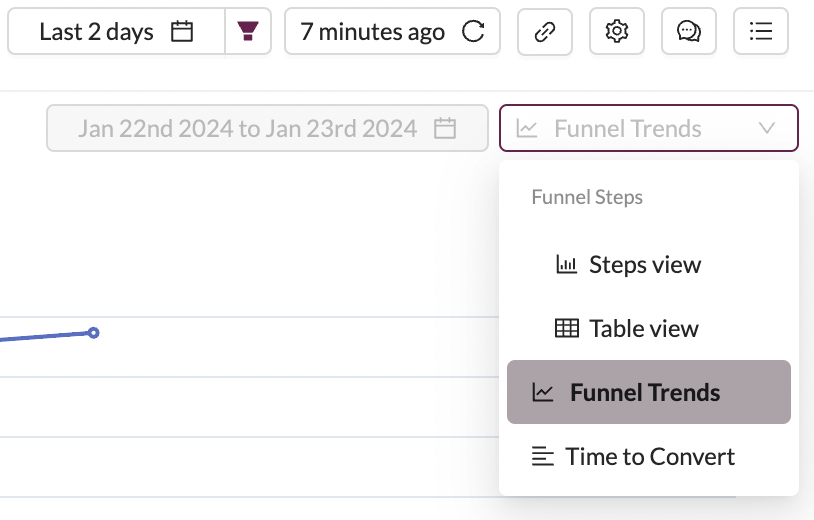
Drop down on top of the viz to select the type of Funnel view
Breakdown
You can split the funnel by different users and event properties like country, device type, etc. This will help in:
- Go deeper and understand the drivers for conversion/drop-offs
- Compare conversion across countries/slots - this can help track A/B experiment performance by comparing conversion numbers across control and experimental groups
Note:
Currently, top 8 dimension values based on the number of users who performed the first step in the Funnel show up on the visualization.
A funnel can be split into parts in three ways:
- Event Properties
- User Properties (common)
- Cohorts
Event Properties
Funnels allow you to break down by event properties of the first event in your configured funnel. Since a Funnel is sequential in nature, the breakdown at the first step results in the breakdown of the entire funnel into components.
Below you have a funnel broken down by the source event property.
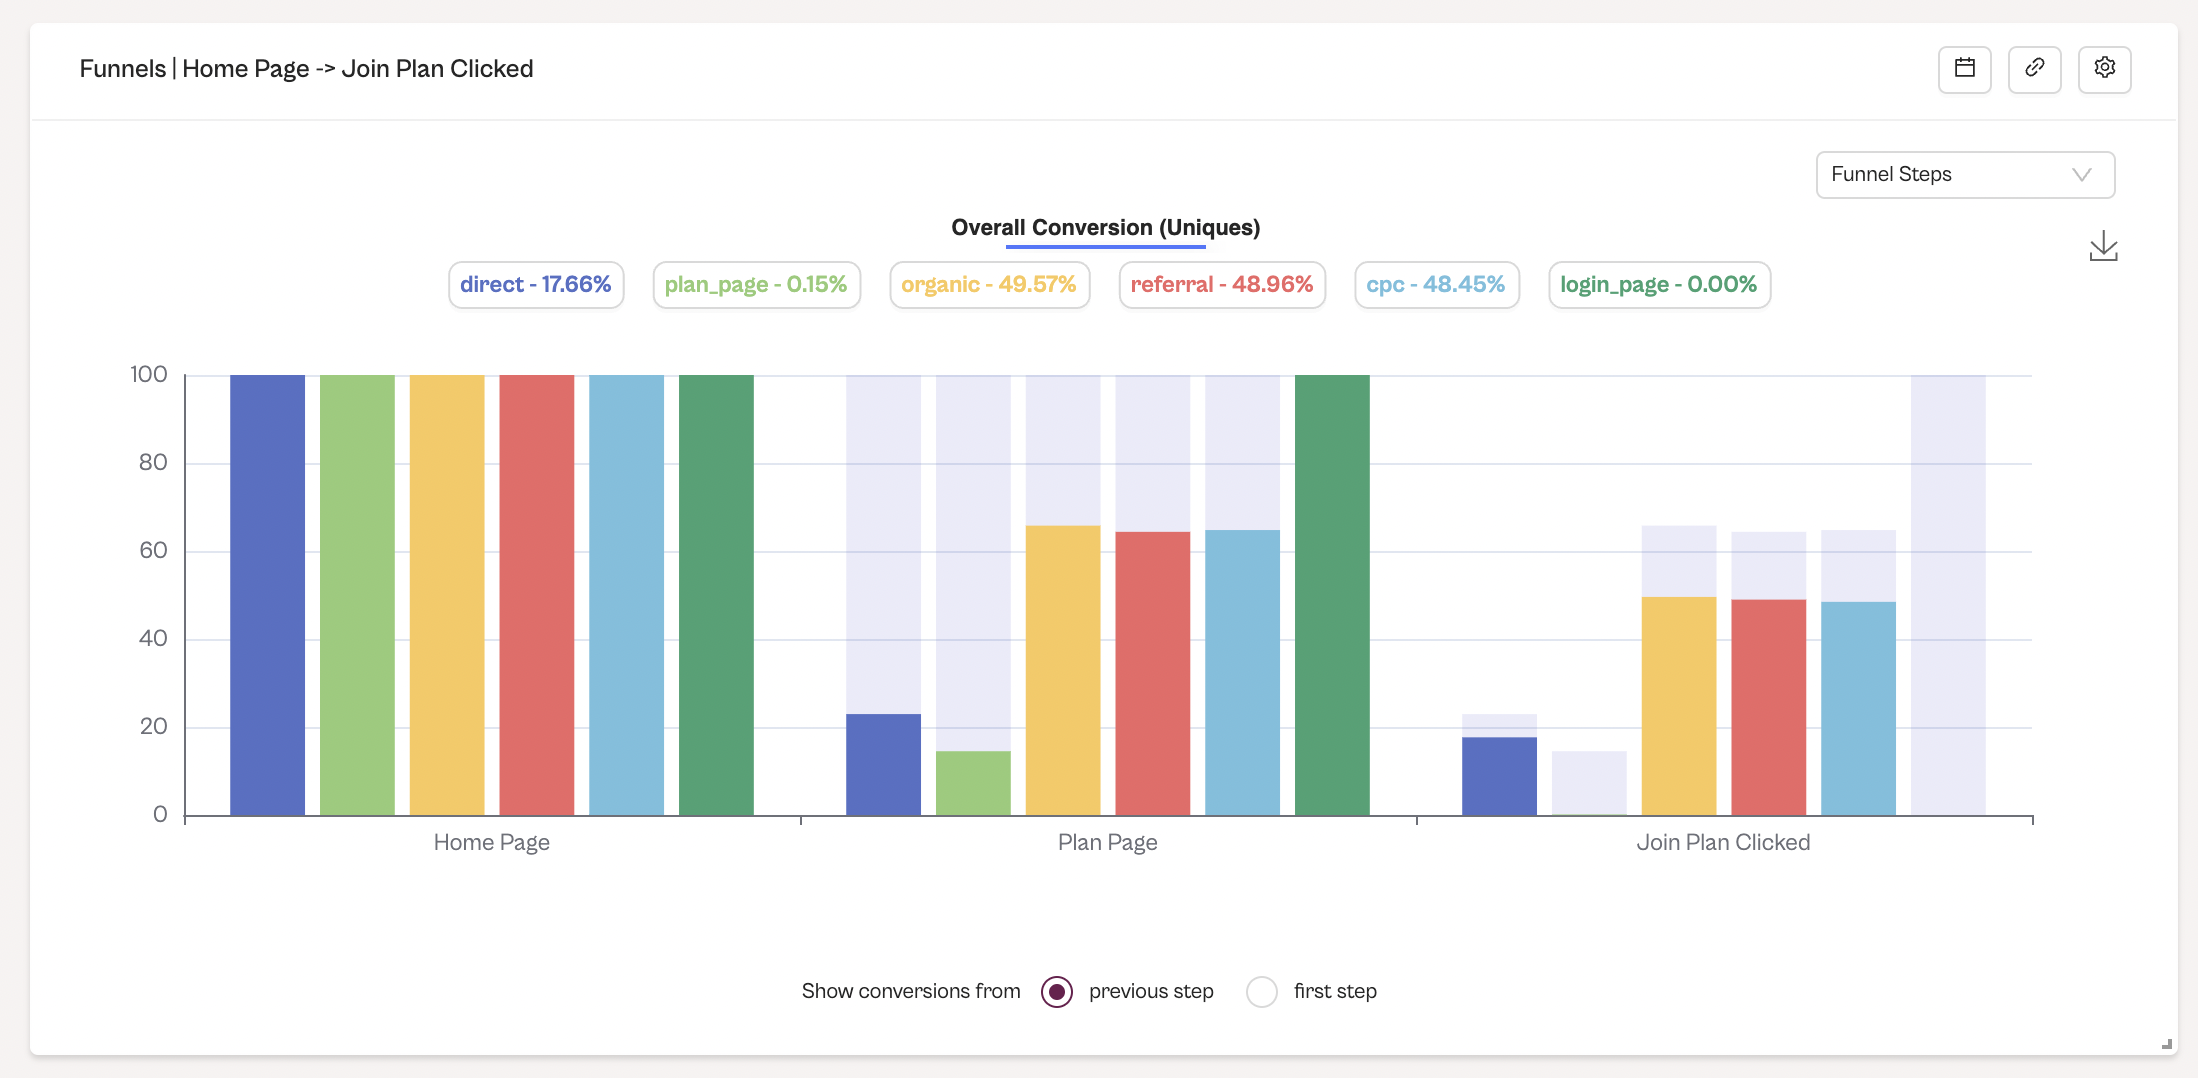
Funnel breakdown
User Properties (Common)
Funnels also allow you to break down events by user properties. Since a Funnel is sequential in nature, the breakdown at the first step results in the breakdown of the entire funnel into components, the same as for event filters.
Below you have a funnel broken down by the city user property.
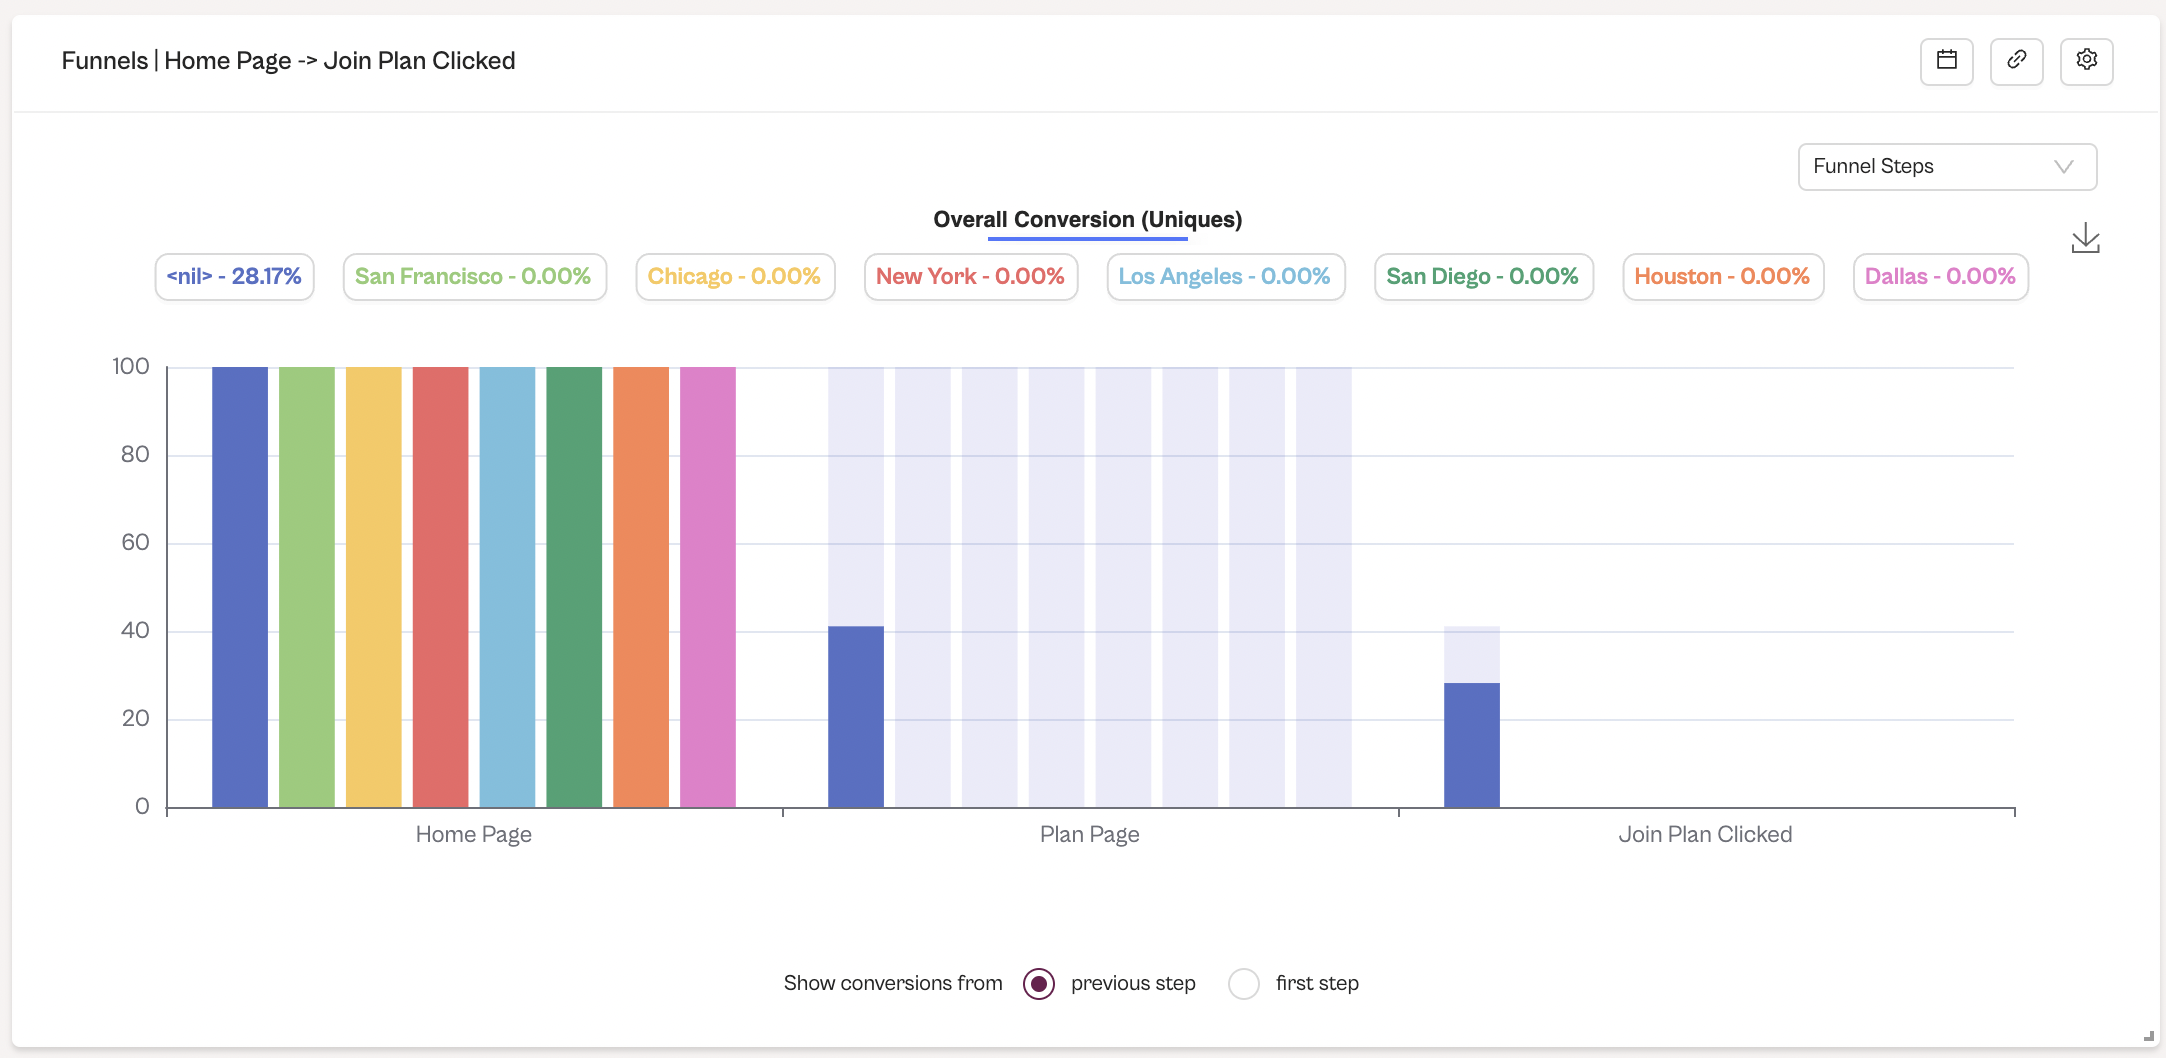
Funnel breakdown by a common user property
Cohorts
You can even breakdown a funnel by a Cohort — letting you compare how users who were in the Cohort and who were not in the Cohort are behaving.
Below you have a funnel with a breakdown applied by the cohort Active California users. To know how to make cohorts, refer to the article: here!
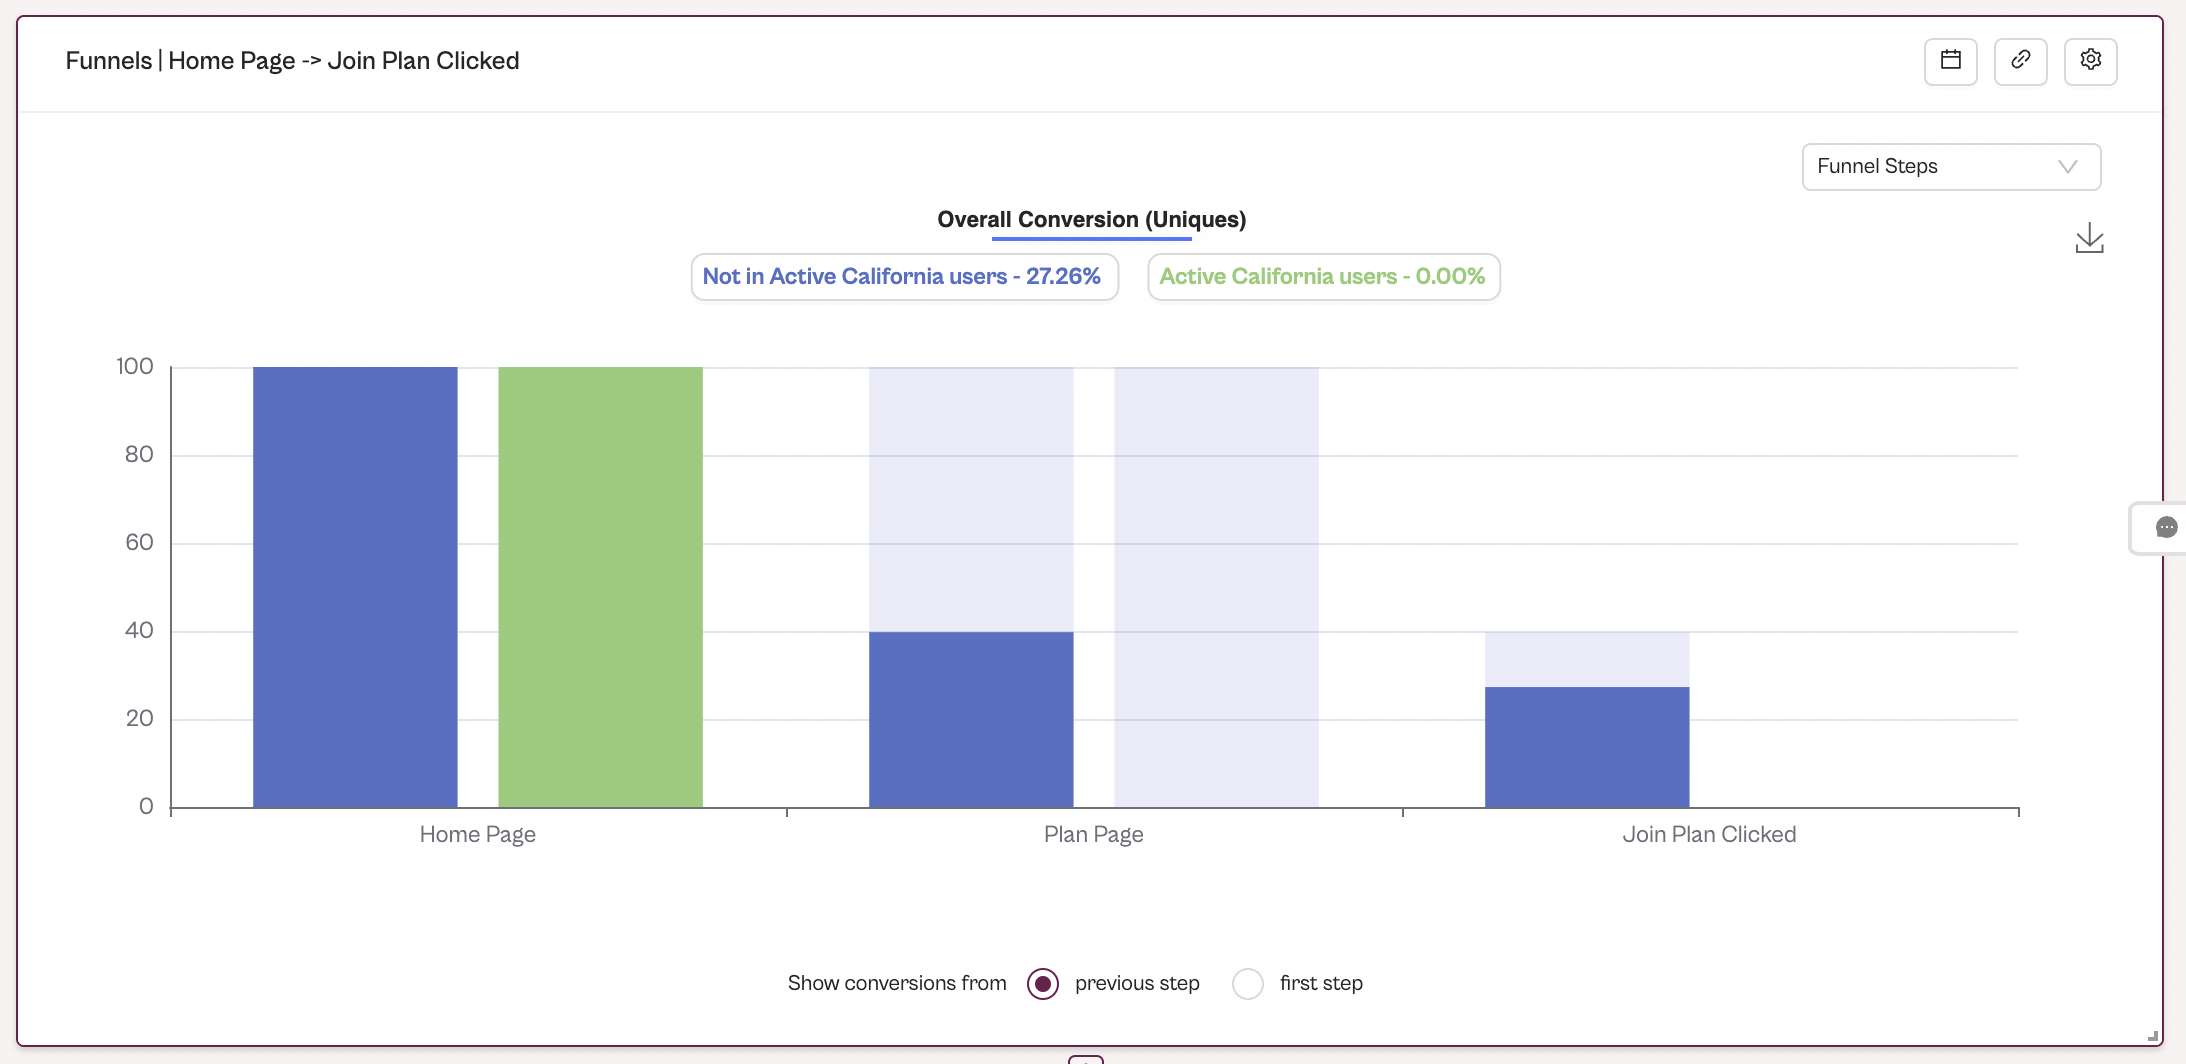
Funnel breakdown by cohorts
Funnel Filters
You can filter the funnel by user properties, event properties, and cohorts, similarly to how we used breakdowns in the previous part.
All the filters that you see in the screenshot below will populate based on the event properties available in your data, and are not static.
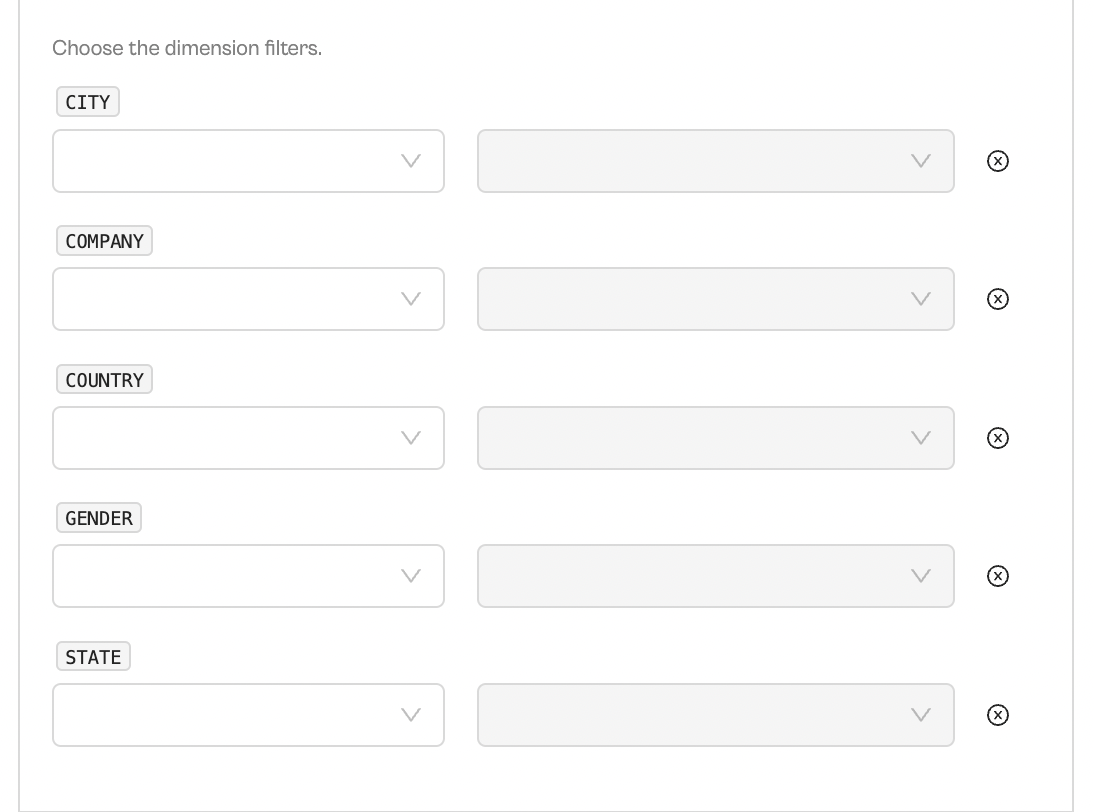
Funnel Filter options
Time Range
You can choose the time frame over which you want the Funnel to be computed in the "Add date-range filter" section. This is specifically helpful when carrying out A/B experimentation.
You can also choose date filters to restrict the analysis to a certain time period of interest. This will allow you to calculate Funnels
Between a date range
- Choose a start date and an end date (both inclusive), Funnels will be calculated over events data in this date range.
- Useful for measuring Funnel performance for a particular A/B test.
Within the Last n days
- Calculate Funnels for the last 3/7/15/30 days.
- This is a rolling date window keeping your Funnels up to date.
Note:
Whenever you make a config change, do not forget to click on 'Save Configurations' button to ensure that your changes are reflected on the visualization.
Your funnel block is fully configured and ready for you to consume!
🤔 FAQ's
Here are some frequently asked user questions about Houseware Funnels.
How is the conversion rate calculated?
To be counted as converted in a Houseware Funnel, all steps configured in the Funnel must be completed, starting from the first step event selected, and within the time interval selected by the user.
For example, you created a Funnel with steps A -> B -> C with a conversion window of 1 hour.
If the user does A at 4pm and then A again at 4:30pm, before doing B at 4:45pm and C at 5:15pm, they would count as converting to B, but will not be counted as completing the entire Funnel to C. This is because 4pm to 5:15pm is greater than one hour.
When counting for uniques (unique users), the conversion window for a given Funnel trial starts with the first instance of A and is not reset by later instances of A in the same trial. B and C need to be completed within the conversion window from the first instance of A to be counted as conversions.
Whereas in the case of Totals (total events), each time the first step event gets triggered, the conversion window gets reset and starts from the latest occurrence of A.
The steps configured in the Funnel are also loosely ordered, as explained at the beginning of the article.
How does Houseware connect events in a funnel?
Houseware sequences the events of a funnel together by using device ID (device_id) and device timestamp (device_ts). Using these two data points, it links the sequences of the events together between a start and endpoint to generate a funnel and calculate the conversion rate at each step.
How can I get a count or % of unique users converted between each Funnel step?
Super easy - just select the Uniques option in the conversion criteria option. Uniques count each user only once (using the device_id column) from the Step 1 event configured within the selected date range. Even if a user completes the Funnel multiple times in the given date range, it will be counted for conversion only once.
Important Note: In uniques, only the first occurence of Step 1 event is considered. If in the first occurence, the user fails to complete all steps of the funnel, it will not be counted as converted, even if it converts in second, third, or later attempts within the selected time period.
Hence, choose your conversion window wisely, based on the contextual information of your events selected for a Funnel!
Whereas if you select the Totals option, each user will be counted for each step as many times as they triggered it within the given time range. Every time the user re-enters the Funnel (that is, triggers step 1), the conversion window time gets reset.
For example, imagine a 3-step funnel: A, B, and C. User 1 does A -> A-> B-> C. In Totals, for step A, the user will be counted twice, whereas for B and C, it will be counted as 1, and conversion will be counted as 1. Also, the time to convert will be counted from the second occurrence of the Step 1 event, and not the first A in this example.
When I apply breakdown to a Funnel, it sometimes shows (null) in the legend; why?
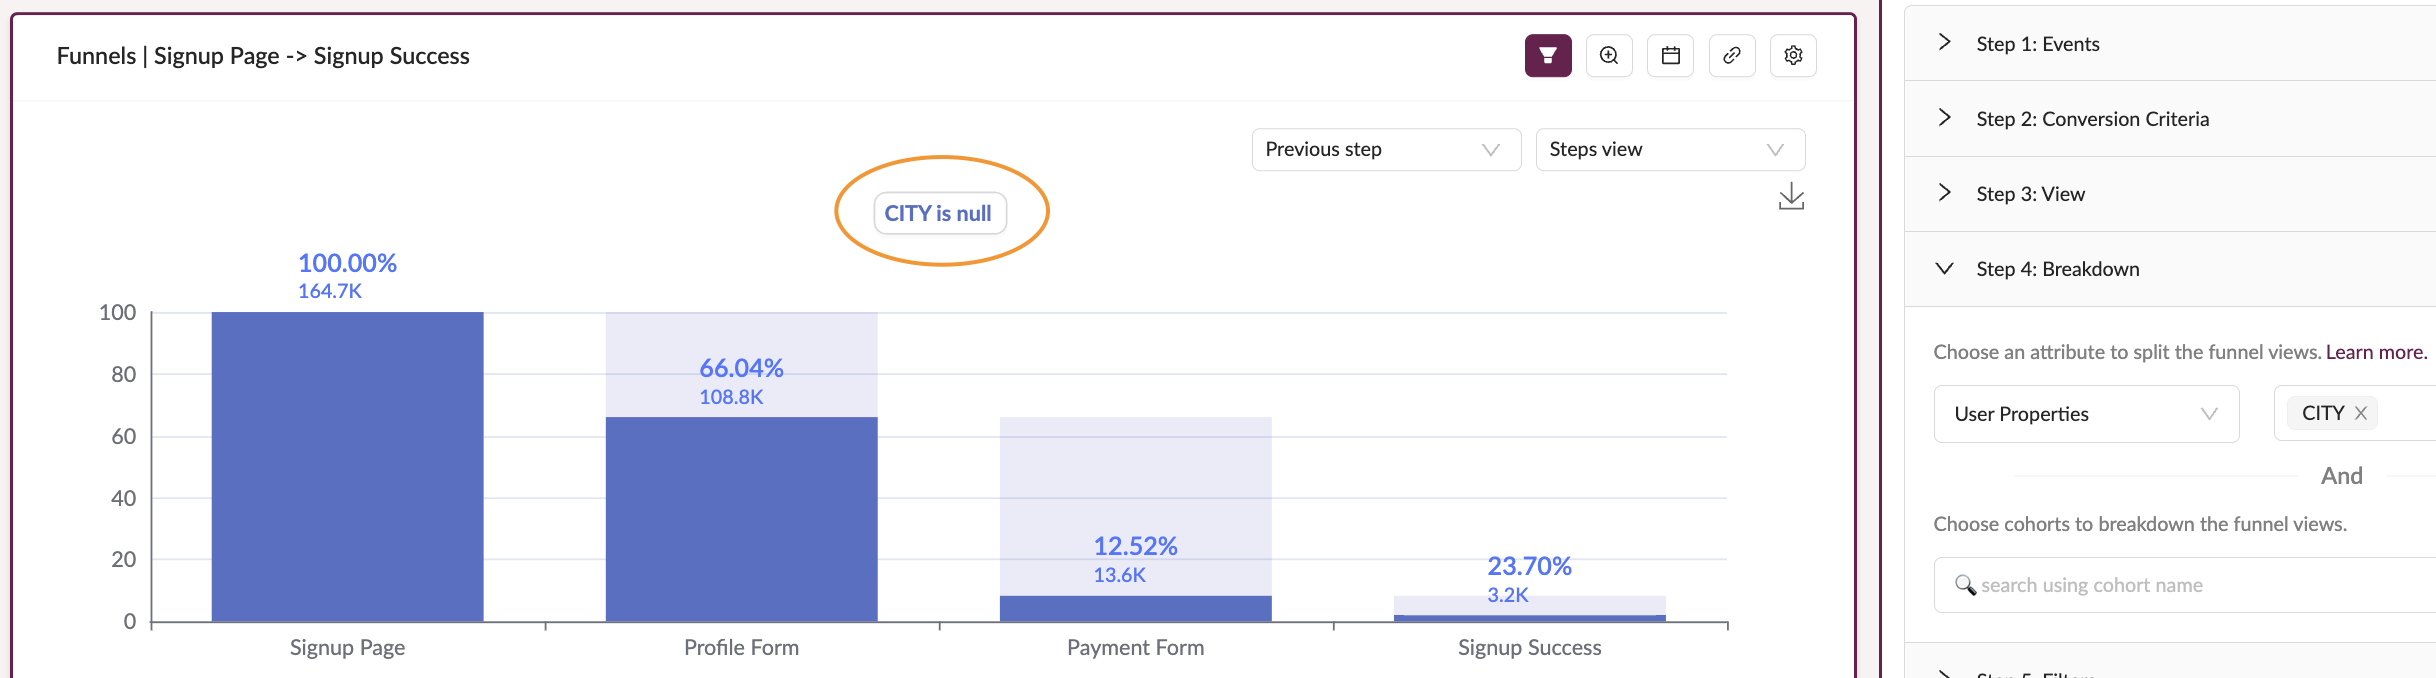
This happens when the events selected in the Funnel do not have the user property associated with them.
For example, in the screenshot above, the sign-up page event does not record the city of the user. Hence city is not an associated property with the first step of the Funnel. Houseware funnels follow 'first-touch attribution', which means if the property is not associated with the first step, even if it is associated with other steps of the Funnel, it will not break down the funnel. Hence, choose the breakdown attributes that are associated with the first step of the funnel events, or it will not break down into desired segments.
How are the time intervals calculated in the 'Time to Convert' view?
Time intervals in the 'Time to Conver' view are calculated based on the 'Steps' and 'Interval size' configured by the user, which then allocates converted users into respective interval buckets.
In the case of Uniques: Each unique user is accounted for in one specific time-interval bucket. This is because the system recognizes and counts a single entry of a user, starting from its first occurrence and consequent completion of the steps in the time range, as selected.
In the case of Totals: Each user might belong to multiple time interval buckets as they are counted every time they re-enter the funnel within the selected time range.
Do the user count and percentage in the 'Time to Convert' view match with the 'Steps' view?
Yes, they match precisely. The percentage and count of users across time intervals will always add up to the value we see in the 'Steps' view.
However, please note, that discrepancies might arise based on your interval size and maximum number of intervals modification. For example, if there are 10 intervals, based on your selected interval size, but you have limited the interval count to 5 for your visualization, then the count and percentage displayed will not add-up to the total converted value accurately. This discrepancy occurs because the remaining 5 intervals, which are hidden, also contribute to the conversion value.
Updated 9 months ago