Flows
How to create Flows on Houseware and use it to identify frequented user paths
Overview
Houseware's no-code, interactive product analytics capabilities empower the user to create powerful visualizations that help in analyzing the product event data the best.
The flow type of visualization helps identify the most frequent paths taken by users to or from any event. Use Flows to understand how your users sequentially perform events in your product and analyze drop-offs or unsuccessful behavior.
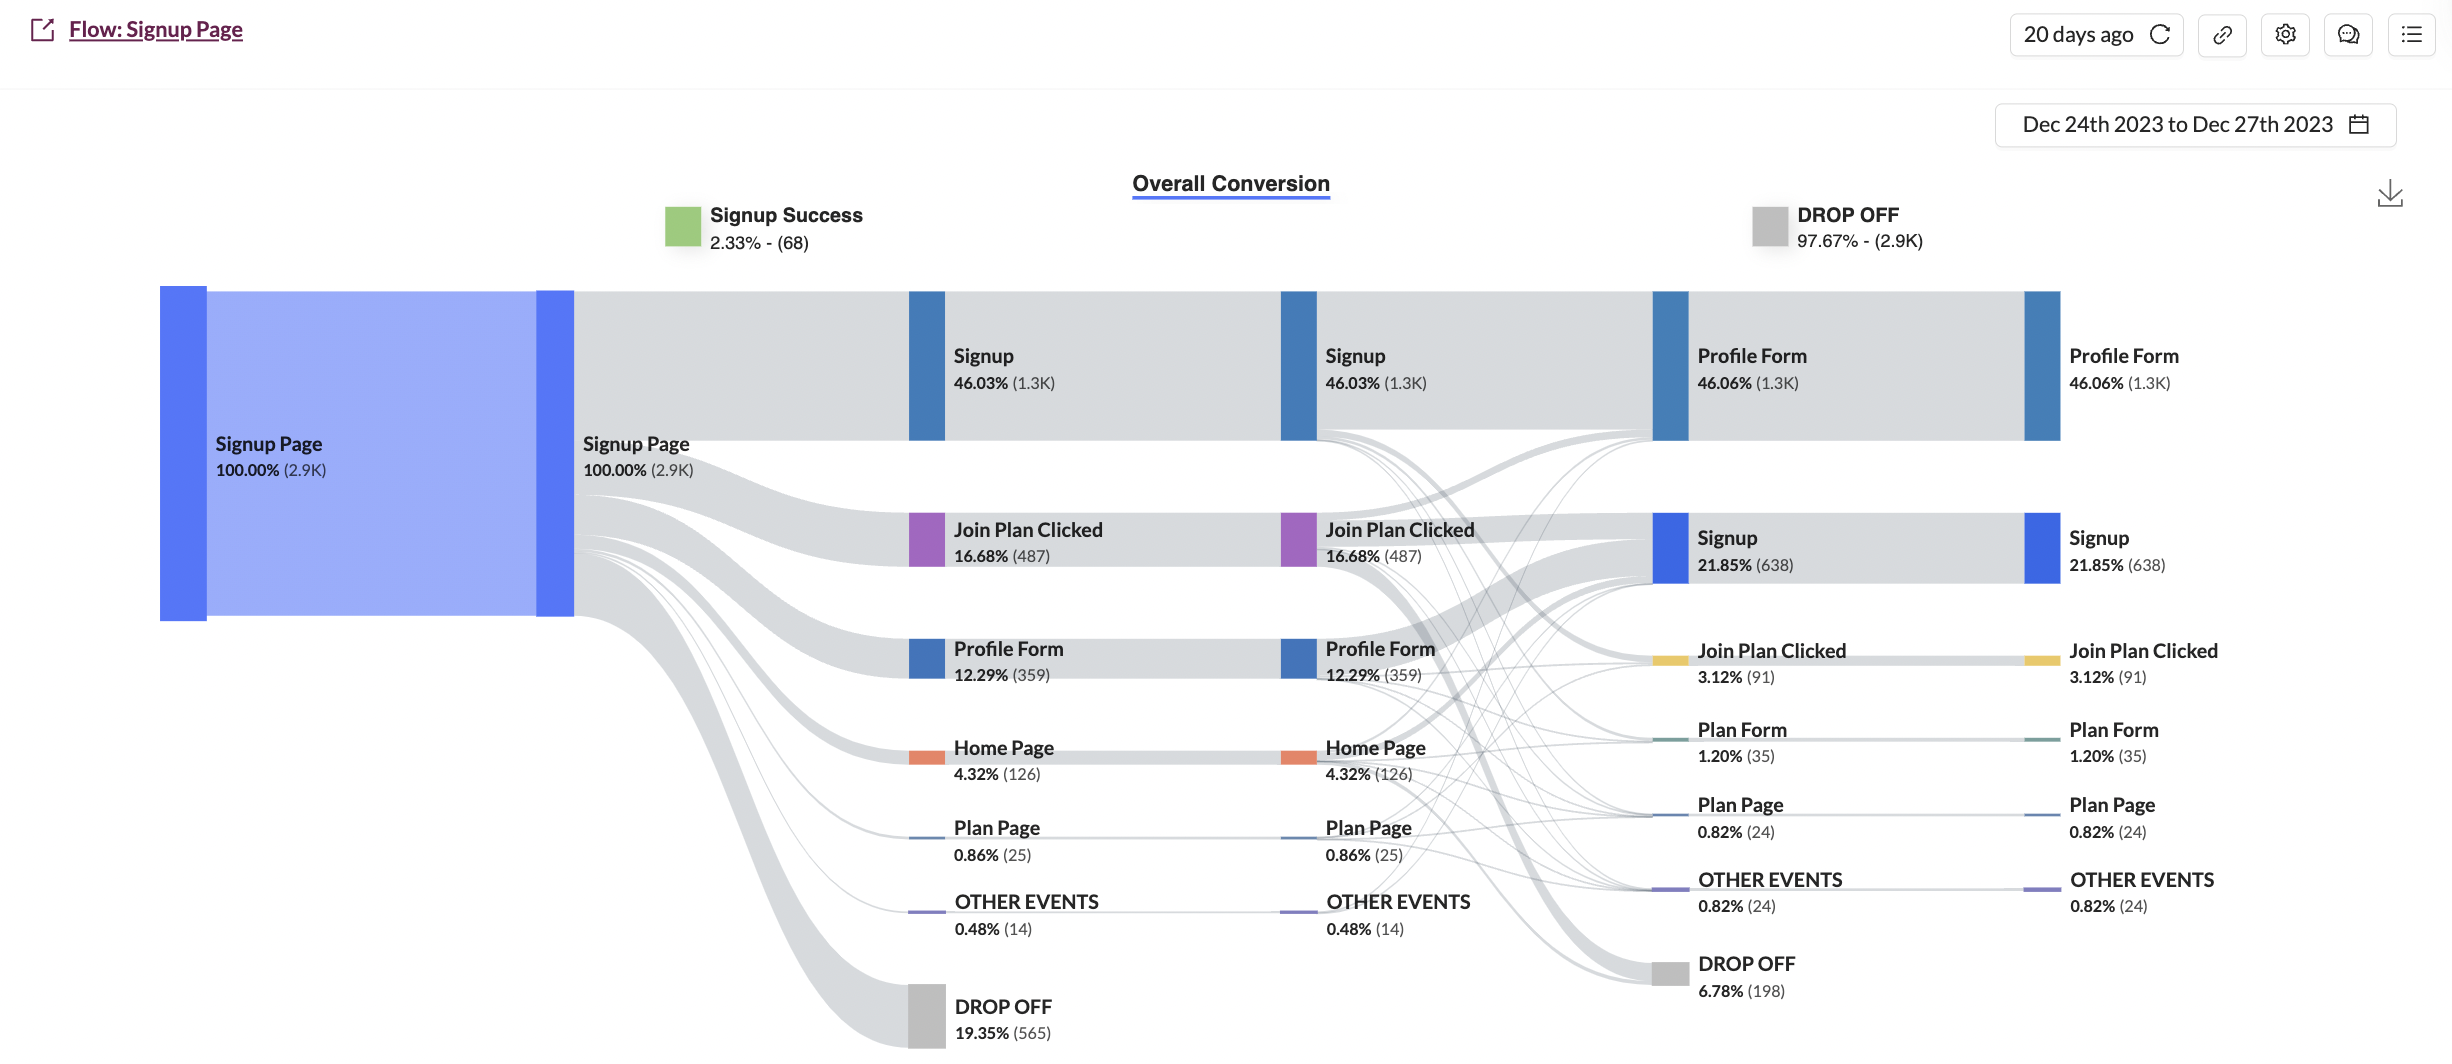
Example Flow on Houseware
What is a Flow?
Flows display a Sankey diagram where the height of the bar is proportional to the number of users who perform that specific event, and the height of the lines that connect bars is proportional to the number of users who perform the two events in sequence. The events at each step are sorted in descending order of frequency.
Hover over a stage of the diagram to highlight it and see the details of that section. This includes the total number of unique users who moved between those two steps on that path and the percentage. Hover over any node representing an event on the Sankey chart to highlight the most popular paths that lead to or from that node.
What counts as a conversion?
Houseware counts Unique User conversions:
- Count a single entry per user, on the first time they perform the event.
- Count a single conversion per user for the conversion event.
To count as a conversion, user needs to finish the conversion event within the configured conversion window of time. Conversion window by default is 1 hour.
Even if a particular user completes the flow multiple times in the date range, they will only be counted towards conversion once.
Use Flows to discover:
Using Flows (aka user journey map) can provide a wealth of insights into user behaviors, preferences, and potential areas of friction in the product experience. Here are some examples:
- Which steps do users commonly (or rarely) take between two points, like signup to successful signup?
- What are the different ways users achieve a goal (conversion event), such as starting training?
- Which route on your product is most or least popular from point X to Y?
- Are there common drop-off points or detours in a user's journey?
- Which features or pages do users interact with before making a key decision or purchase?
- Are there unexpected routes or sequences users are taking that weren't initially designed or anticipated?
How to create a Flow?
Here is the step-wise guide to help you create a Flow visualization on Houseware.
Step 1: Choose the Flow type of visualization on your workspace
- On your workspace, select the + icon to add a new Block (or hover over an existing block to see the + icon below it).
- Hover over visualizations as the block type, and select Flows as your visualization type.
Step 2: Configure the Flow settings as per your needs
Once your Flow block is created, a config selection menu will open on the right-hand side. You can choose the following to generate the Flow as per your requirement.
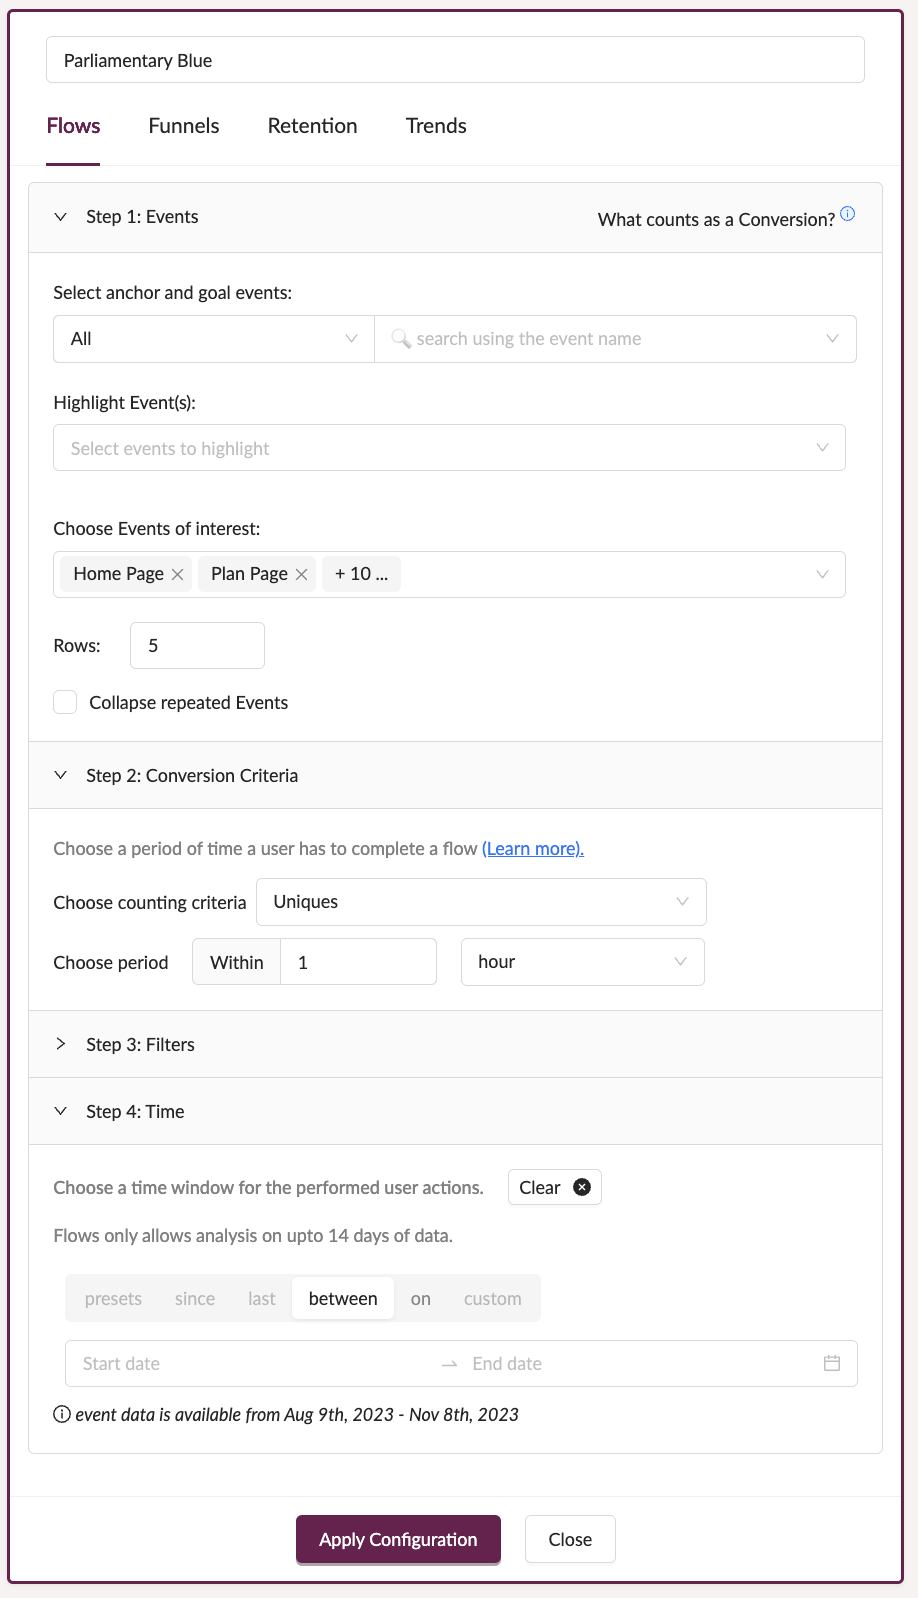
Flow configuration options
-
Events: Select Events that you want to see in the Funnel sequence. Here you can select upto 2 events
- Anchor event (A) refers to the event before and after which, the frequent paths and steps taken will be inspected. The first event is the Anchor event.
- Based on this event, A+1, A+2 ..... and A-1, A-2 ..... steps are generated in the Flow that comprises the sequential events performed by the user, sorted by occurrence frequency. At each step, you can see the number and percentage of users performing that event or dropping off (relative to the anchor event).
- With the Anchor event, you can specify
- Steps Before which is the number of steps before the anchor event. Defaults to 0, can go upto 8. You can use this to analyze last-click attribution and answer questions like "What steps lead up to a sign-up?" or "What steps lead to a first purchase", and more.
- Steps After which is the number of steps after the anchor event. Defaults to 5, can go upto 8.
- Conversion event (optional) is the event for which you wish to calculate the step-wise and overall unique user conversions. The second event is considered the Conversion event.
- Highlight events (optional) help you bring particular events of interest to the top of the Flows - so that you can analyze journeys in the context of these specific events (that may in other circumstances get hidden under "Other events").
- Events of Interests (optional) help you restrict your analysis to a subset of events. By default, all your available events are considered for the analysis. You can remove events that are not relevant for your analysis. Restricting the analysis to a sub set of events makes the analysis compute faster and cheaply.
- Rows determine the number of most frequently performed events to be shown at each step. This defaults to 5, and can go upto 10(not counting Goal Events, Highlight Events, Other Events and Drop Off). Less common events performed by fewer users are combined into an "Other events" section. To view more events, simply increase the number of Rows to view.
- Collapse Repeated Events determines whether to collapse events that happen back to back into one event. This is useful when the user analysis requires clubbing repeated multiple events of the same type under one logical action and then analyse user steps or when there are issues with event instrumentation such that the same event is getting fired multiple times. By default, this is disabled.
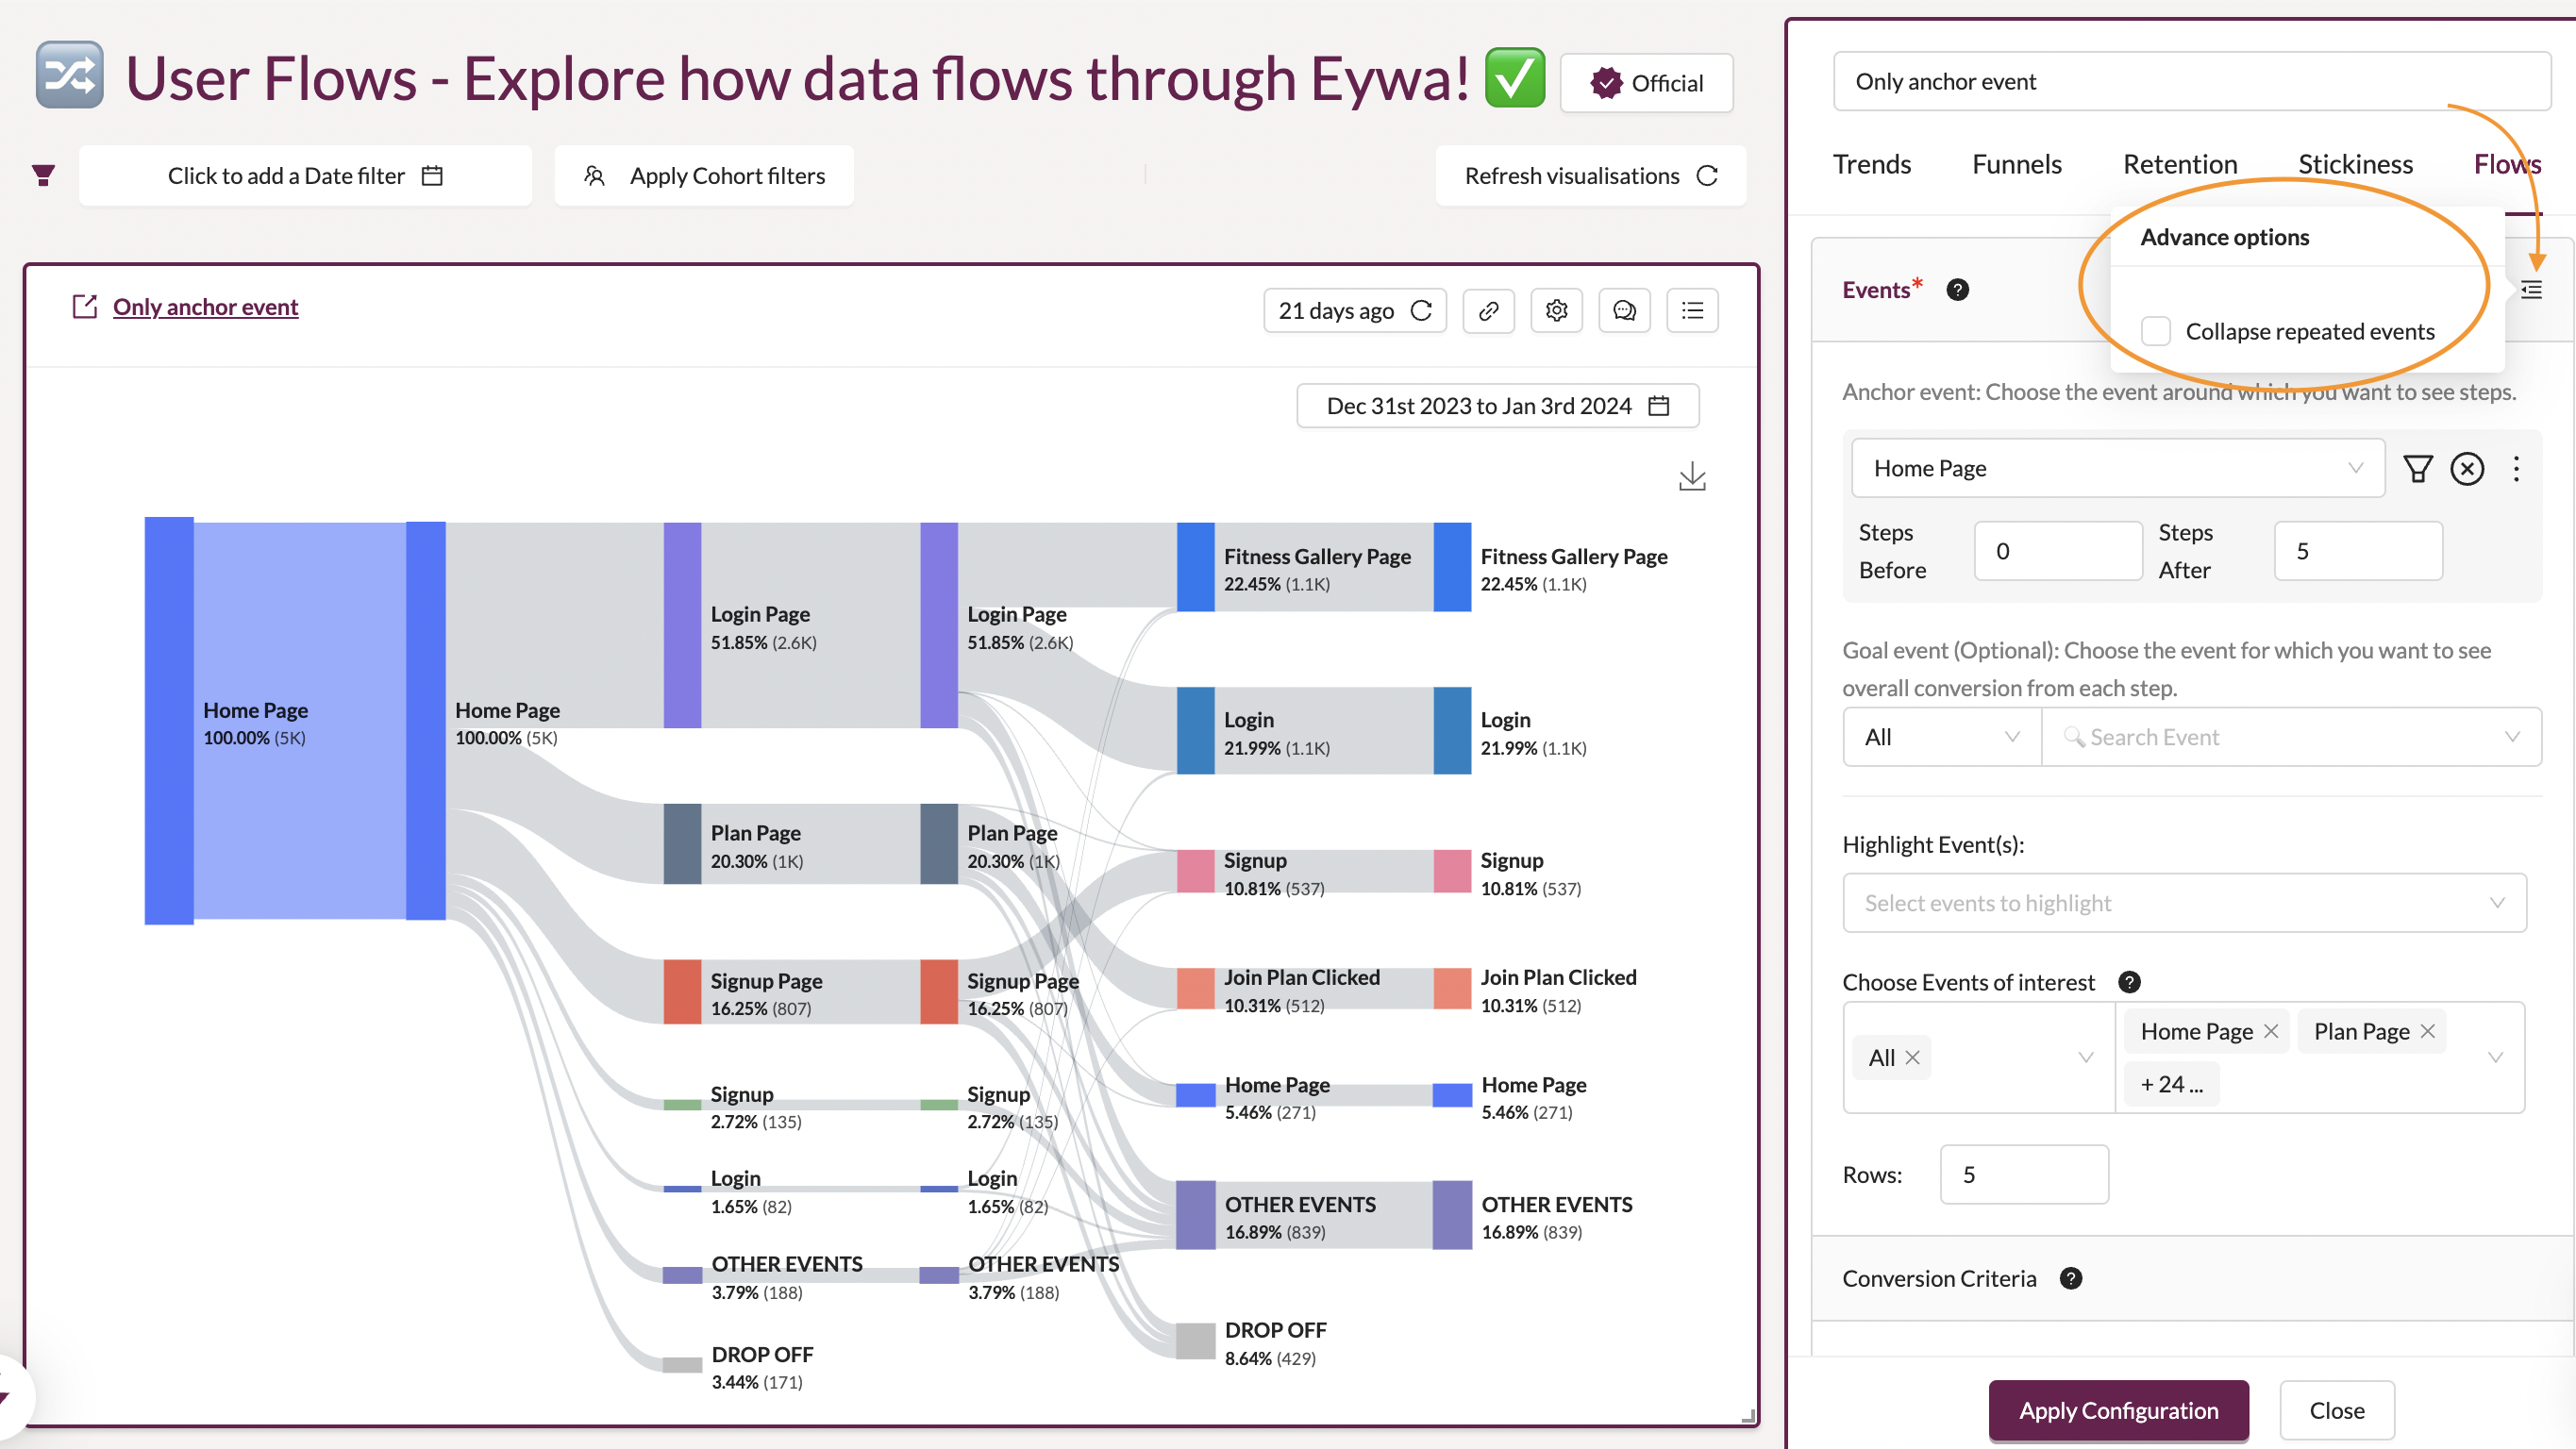
Option to collapse repeated events on Flows
- Anchor event (A) refers to the event before and after which, the frequent paths and steps taken will be inspected. The first event is the Anchor event.
Note:
The event list is sorted in descending order of the event count for generating the flow, i.e., the event that has occurred most will appear on top, and so on.
- Conversion Criteria:
- Counting Criteria: Flows let you count the number of unique users performing actions on the product.
- Conversion Window: Choose under what time duration a user should be converted to be counted in your flows conversion. Events performed outside of the conversion window will not show up on the visualization for that user. Defaults to 1 hour.
- Filters:
- Users can analyze the Flows on cuts across event/user properties like country, locale, device type etc.
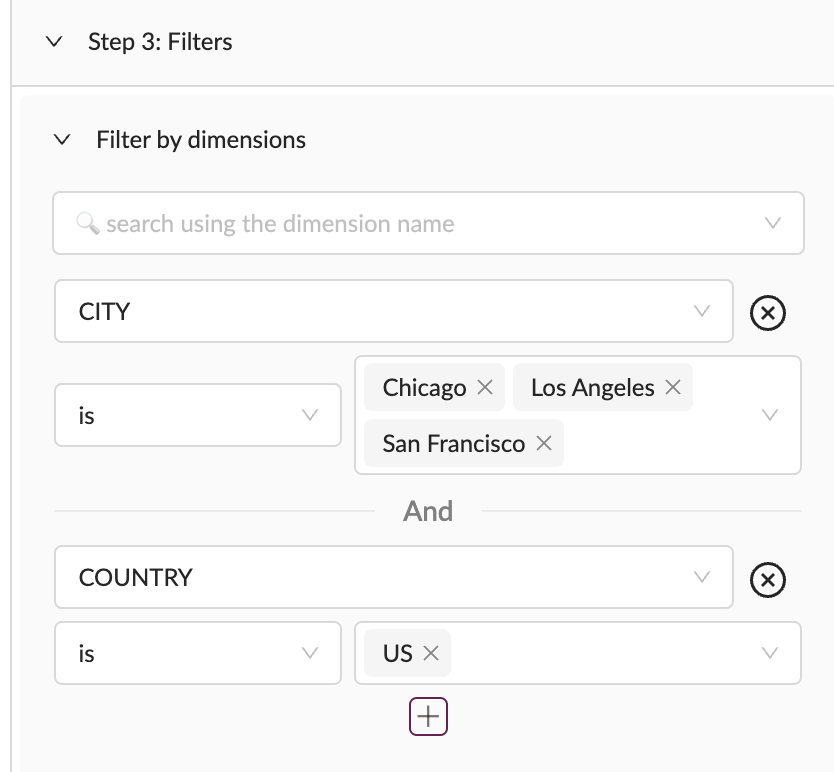
Dimension filters in Flows
Note:
The various dimensions that are available for filtering here are according to the properties that are associated with users/events in your product data. Request dimensions if you don't see the one(s) of your choice.
- Time filters help you to analyse your user flows for a selected time period.
Note:
Flows only allow static date filters that can range upto a span of maximum 14 days
Once you have selected your config options, click on the Save Configuration button at the bottom, to save your settings, and see your visualization come to life. Happy tracking! 🤩
Caching in Flows
Due to their exploratory analysis nature, Flows analyse a large number of events (all events by default) unlike other visualizations like Funnels, Trends & Retention. This means that computing Flows can be both time consuming and expensive on the warehouse.
As a result, Houseware caches Flows results for a specific visualization upto a period of 7 days. The last time at which the Flows were calculated are shown at the top right of each Flows visualization & you can explicitly recompute Flows if need be by clicking on the refresh button next to it.
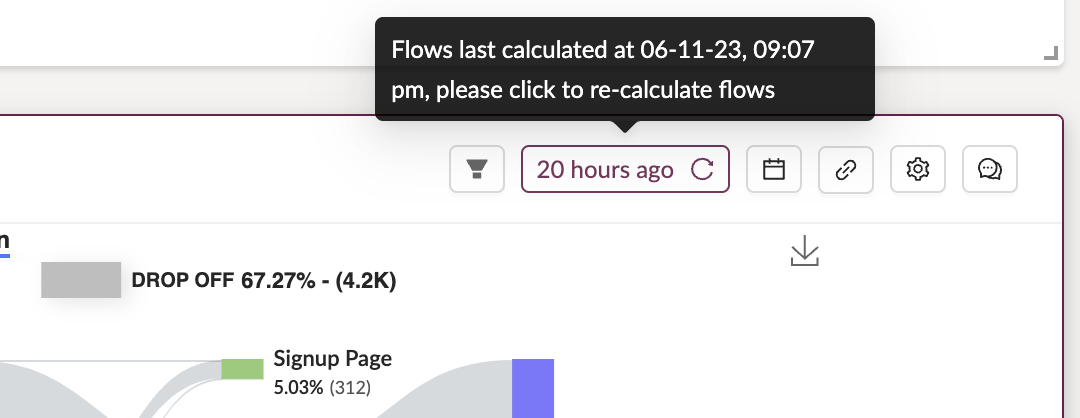
Caching in Flows
🤔 FAQs
Here are some frequently asked user questions about Houseware Flows.
How is the conversion rate in Flows calculated between each step?
In Flows, the conversion rate is calculated for each action taken between the Anchor and Conversion event, as configured by the user. The data labels shown in the visualization are unique count and % of users. To calculate conversion, it only considers a single entry per user, on the first time they trigger the anchor event.
Note: The anchor event helps in determining the total users (denominator to calculate % conversion) at each action event, before and after the anchor event. Example shown in the screenshot below.
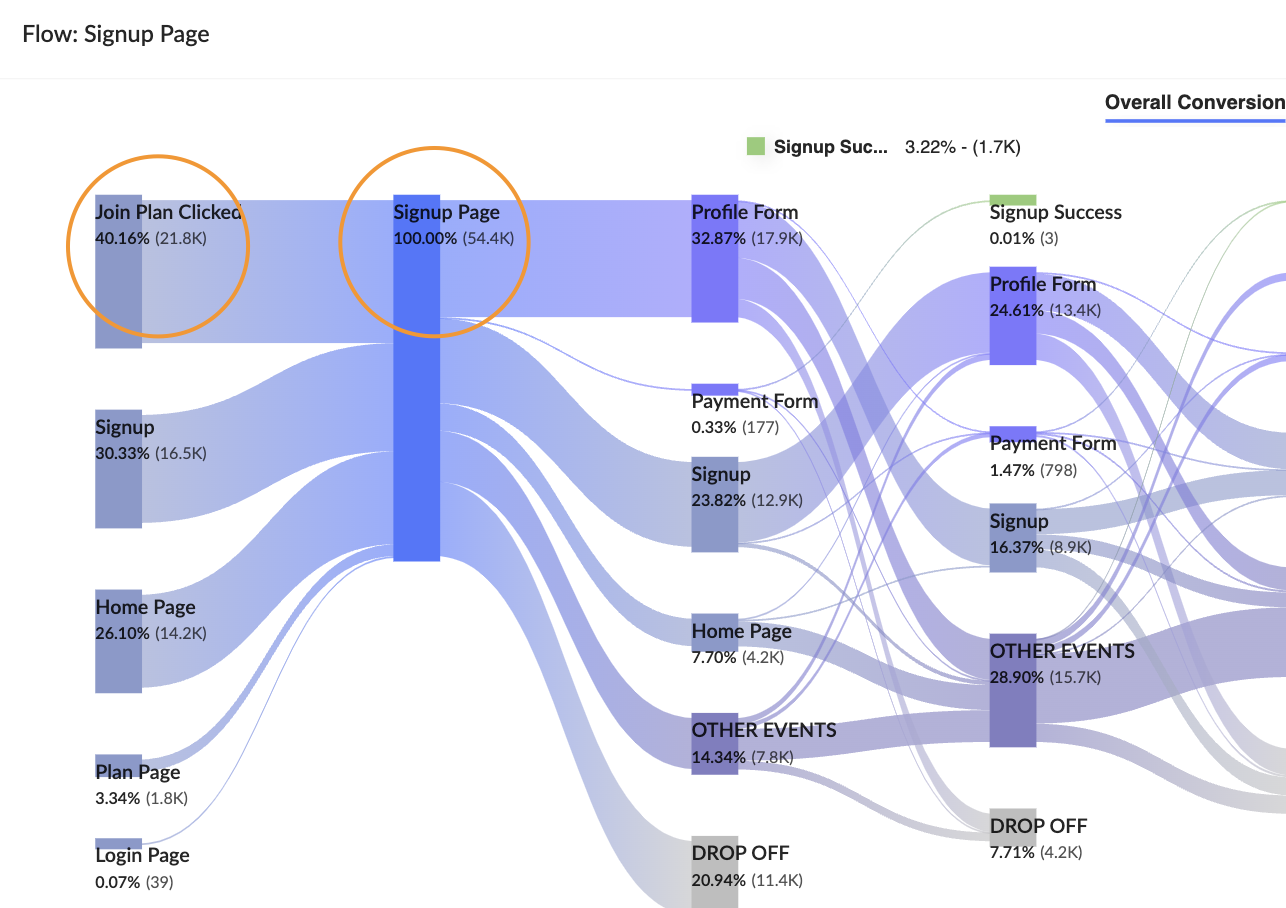
Join Plan Clicked: 40.16% = 21.8k/54.4k
Hence, even though the number of users who did Join Plan Clicked might be more than 21.8K, for this flow, where the anchor event is Signup Page they will be calculated out of only the users who did Signup Page action.
Also, the time period considered for conversion in Flows is 365 days or the time duration of the full available data, whichever is lesser. Currently, this cannot be configured by the user.
How do conversion rates in Flows differ from Funnels?
Think of Funnels like a fixed path: A -> B -> C. Users must follow this exact order for it to count. But with Flows, it's more flexible. Users can take any sequence between the starting (anchor event) and ending point (conversion event), and it'll count. So, while Funnels are strict about the order, Flows give freedom to the journey.
How does Houseware connect events in Flows?
Houseware sequences the events of a Flow together using the device ID (device_id) and device timestamp (device_ts) columns of the allevents schema. Using these two data points, it links the sequences of the events together between the anchor and conversion event to map out all steps in between.
What is the time period for a Flow conversion?
By default, the conversion window for Flows is 1 hour. Like Funnels, in Flows, a conversion window or time range can also be configured by the user.
What do the data labels on Flow visualization represent?
The percentage and absolute numbers in brackets represent the unique percentage and count of users who completed the action, as mentioned on top of these values in the visualization.
How can we split 'Other Events' into granular events?
As you set up your Flow visualization, you can make it more granular by increasing the number of events that occurred between the anchor and conversion event. You can do that by increasing the number of rows in the configuration, as shown in the GI below. The number of rows option determines the number of most frequent steps shown in the Flow.
How to make your Flow visualization more detailed
Updated 9 months ago